Categorieën in Bulnes
Industries
Bedrijfsdistributie per sector in Bulnes
Feiten over Bulnes
| Gebied | 24.3 km² |
| Bevolking | 12.449 |
| Mannelijke bevolking | 6.182 (49.7%) |
| Vrouwelijke bevolking | 6.267 (50.3%) |
| Bevolkingsverandering (1975 to 2020) | +9.2% |
| Bevolkingsverandering (2000 to 2020) | -2.9% |
| Gemiddelde leeftijd | 32.4 jaar (Man: 31.7, Vrouw: 33) |
| Netnummers | 42 |
| Buurten | Concepci |
| Lokale tijd | |
| Tijdzone | Chileense standaardtijd |
| Breedte- & lengtegraad | -36.74232, -72.29854 |
| Postcodes | 3930000 |
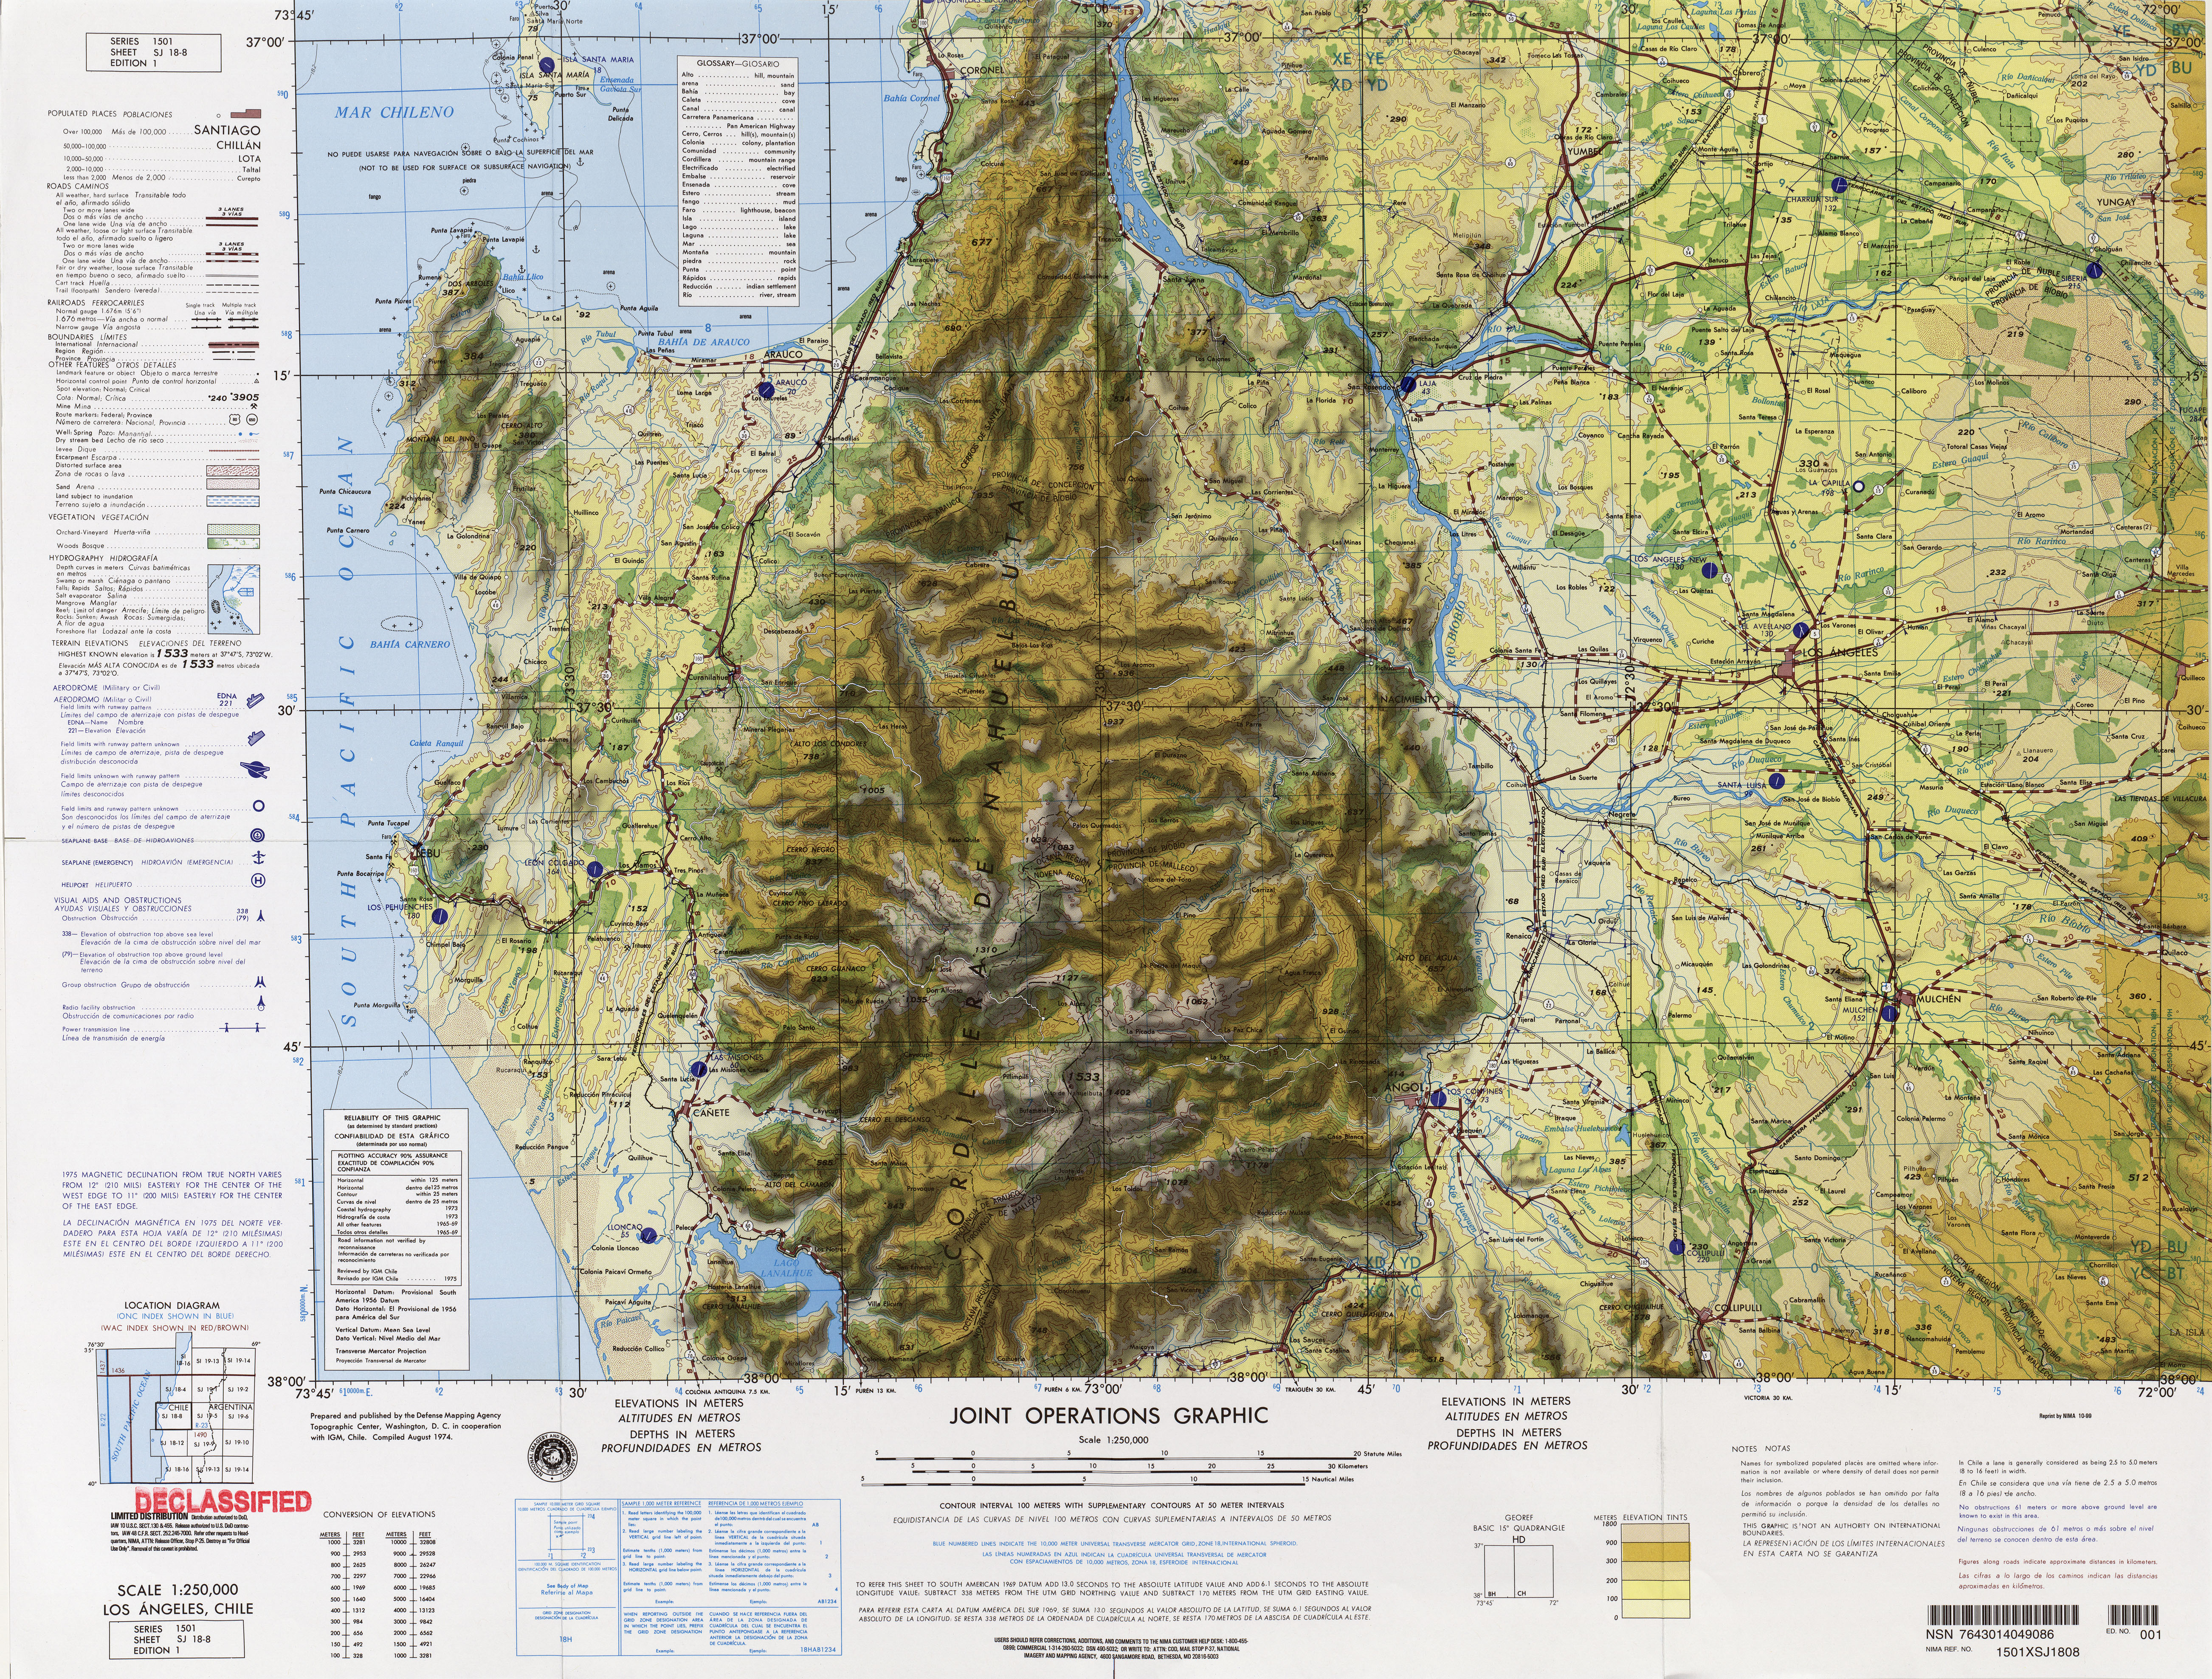
Kaart van Bulnes
Interactieve kaart
Bevolking van Bulnes
Jaren 1975 tot 2020
| Data | 1975 | 1990 | 2000 | 2015 | 2020 |
|---|---|---|---|---|---|
| Bevolking | 11.403 | 13.759 | 12.816 | 11.932 | 12.449 |
| Bevolkingsdichtheid | 470,2 / km² | 567,4 / km² | 528,5 / km² | 492 / km² | 513,4 / km² |
Bevolkingsverandering van Bulnes van 2000 tot 2015
Daling van 6.9% van jaar 2000 tot 2015
| Locatie | Verandering sinds 1975 | Verandering sinds 1990 | Verandering sinds 2000 |
|---|---|---|---|
| Bulnes | +4.6% | -13.3% | -6.9% |
| Biobío (regio) | — | -34.6% | -15% |
| Chili | +72.2% | +36.6% | +18.3% |
Mediane leeftijd in Bulnes
Mediane leeftijd: 32.4 jaar
| Locatie | Gemiddelde leeftijd | Mediane leeftijd (vrouw) | Mediane leeftijd (mannelijk) |
|---|---|---|---|
| Bulnes | 32.4 yrs | 33 yrs | 31.7 yrs |
| Biobío (regio) | 32.4 yrs | 33 yrs | 31.7 yrs |
| Chili | 31.3 yrs | 32 yrs | 30.6 yrs |
Bevolkingsdichtheid van Bulnes
Bevolkingsdichtheid: 513 / km²
| Locatie | Bevolking | Gebied | Dichtheid |
|---|---|---|---|
| Bulnes | 12.449 | 24,3 km² | 513 / km² |
| Biobío (regio) | 17 | 6,2 km² | 2,7 / km² |
| Chili | 17,8 million | 751.744,8 km² | 23,7 / km² |
Historische en geprojecteerde bevolking van Bulnes
Geschatte bevolking van 100 tot 2100
- JRC (European Commission's Joint Research Centre) werken aan de GHS built-up grid
- CIESIN (Center for International Earth Science Information Network)
- [Link] Klein Goldewijk, K., Beusen, A., Doelman, J., and Stehfest, E.: Anthropogenic land use estimates for the Holocene – HYDE 3.2, Earth Syst. Sci. Data, 9, 927–953, https://doi.org/10.5194/essd-9-927-2017, 2017.
Prijsverdeling
Bedrijfsspreiding voor Bulnes
Human Development Index (HDI)
Statistische samengestelde index van levensverwachting, opleiding en inkomen per hoofd van de bevolking.
CO2-uitstoot van Bulnes
Kooldioxide (CO2) -emissies per hoofd van de bevolking in ton per jaar
| Locatie | CO2 uitstoot | CO2-uitstoot per hoofd van de bevolking | CO2-emissie-intensiteit |
|---|---|---|---|
| Bulnes | 54,373 tn | 4.37 tn | 2,242.2 tons/km² |
| Biobío (regio) | 74 tn | 4.33 tn | 11.8 tons/km² |
| Chili | 87,296,657 tn | 4.91 tn | 116.1 tons/km² |
| CO2-uitstoot 2013 (ton/jaar) | 54,373 tn |
| CO2-uitstoot 2013 (ton/jaar) per hoofd van de bevolking | 4.37 tn |
| CO2-uitstootintensiteit 2013 (ton/km²/jaar) | 2,242.2 tons/km² |
Natuurlijk gevarenrisico
Relative risk out of 10
| Gevaar | Risk Level |
|---|---|
| Drought | High (8) |
| Earthquake | Medium (7) |
* Risk, particularly concerning flood or landslide, may not be for the entire area.
- Dilley, M., R.S. Chen, U. Deichmann, A.L. Lerner-Lam, M. Arnold, J. Agwe, P. Buys, O. Kjekstad, B. Lyon, and G. Yetman. 2005. Natural Disaster Hotspots: A Global Risk Analysis. Washington, D.C.: World Bank. https://doi.org/10.1596/0-8213-5930-4.
- Center for Hazards and Risk Research - CHRR - Columbia University, Center for International Earth Science Information Network - CIESIN - Columbia University, and International Research Institute for Climate and Society - IRI - Columbia University. 2005. Global Drought Hazard Frequency and Distribution. Palisades, NY: NASA Socioeconomic Data and Applications Center (SEDAC). https://doi.org/10.7927/H4VX0DFT.
- Center for Hazards and Risk Research - CHRR - Columbia University, Center for International Earth Science Information Network - CIESIN - Columbia University. 2005. Global Earthquake Hazard Distribution - Peak Ground Acceleration. Palisades, NY: NASA Socioeconomic Data and Applications Center (SEDAC). https://doi.org/10.7927/H4BZ63ZS.
Recente aardbevingen in de buurt
Magnitude 3.0 en hoger
| Datum▼ | Tijd↕ | Magnitude↕ | Distance↕ | Diepte↕ | Locatie↕ | Link |
|---|---|---|---|---|---|---|
| 5/17/19 | 1:09 AM | 4.4 | 34.9 km | 84,930 m | 34km SE of Bulnes, Chile | usgs.gov |
| 4/4/17 | 8:53 AM | 4.2 | 49.9 km | 83,230 m | 12km NW of San Carlos, Chile | usgs.gov |
| 10/20/16 | 4:38 AM | 4.4 | 39.1 km | 53,900 m | 38km ENE of Tome, Chile | usgs.gov |
| 1/10/16 | 4:36 AM | 4.7 | 50.7 km | 40,790 m | 37km NE of Tome, Chile | usgs.gov |
| 9/3/15 | 1:37 PM | 5 | 26.1 km | 60,000 m | 26km WSW of Bulnes, Chile | usgs.gov |
| 8/15/15 | 4:11 AM | 4.5 | 17.4 km | 65,000 m | 17km WSW of Bulnes, Chile | usgs.gov |
| 8/11/14 | 10:13 PM | 4.3 | 40.6 km | 49,780 m | 31km NW of Chillan, Chile | usgs.gov |
| 11/14/13 | 7:15 AM | 4.1 | 49.9 km | 10,000 m | 15km SE of Yumbel, Chile | usgs.gov |
| 9/10/13 | 12:58 AM | 4 | 51.2 km | 49,400 m | 13km SE of Yumbel, Chile | usgs.gov |
| 4/24/13 | 8:58 AM | 4.2 | 25.4 km | 84,300 m | 21km NNW of Bulnes, Chile | usgs.gov |
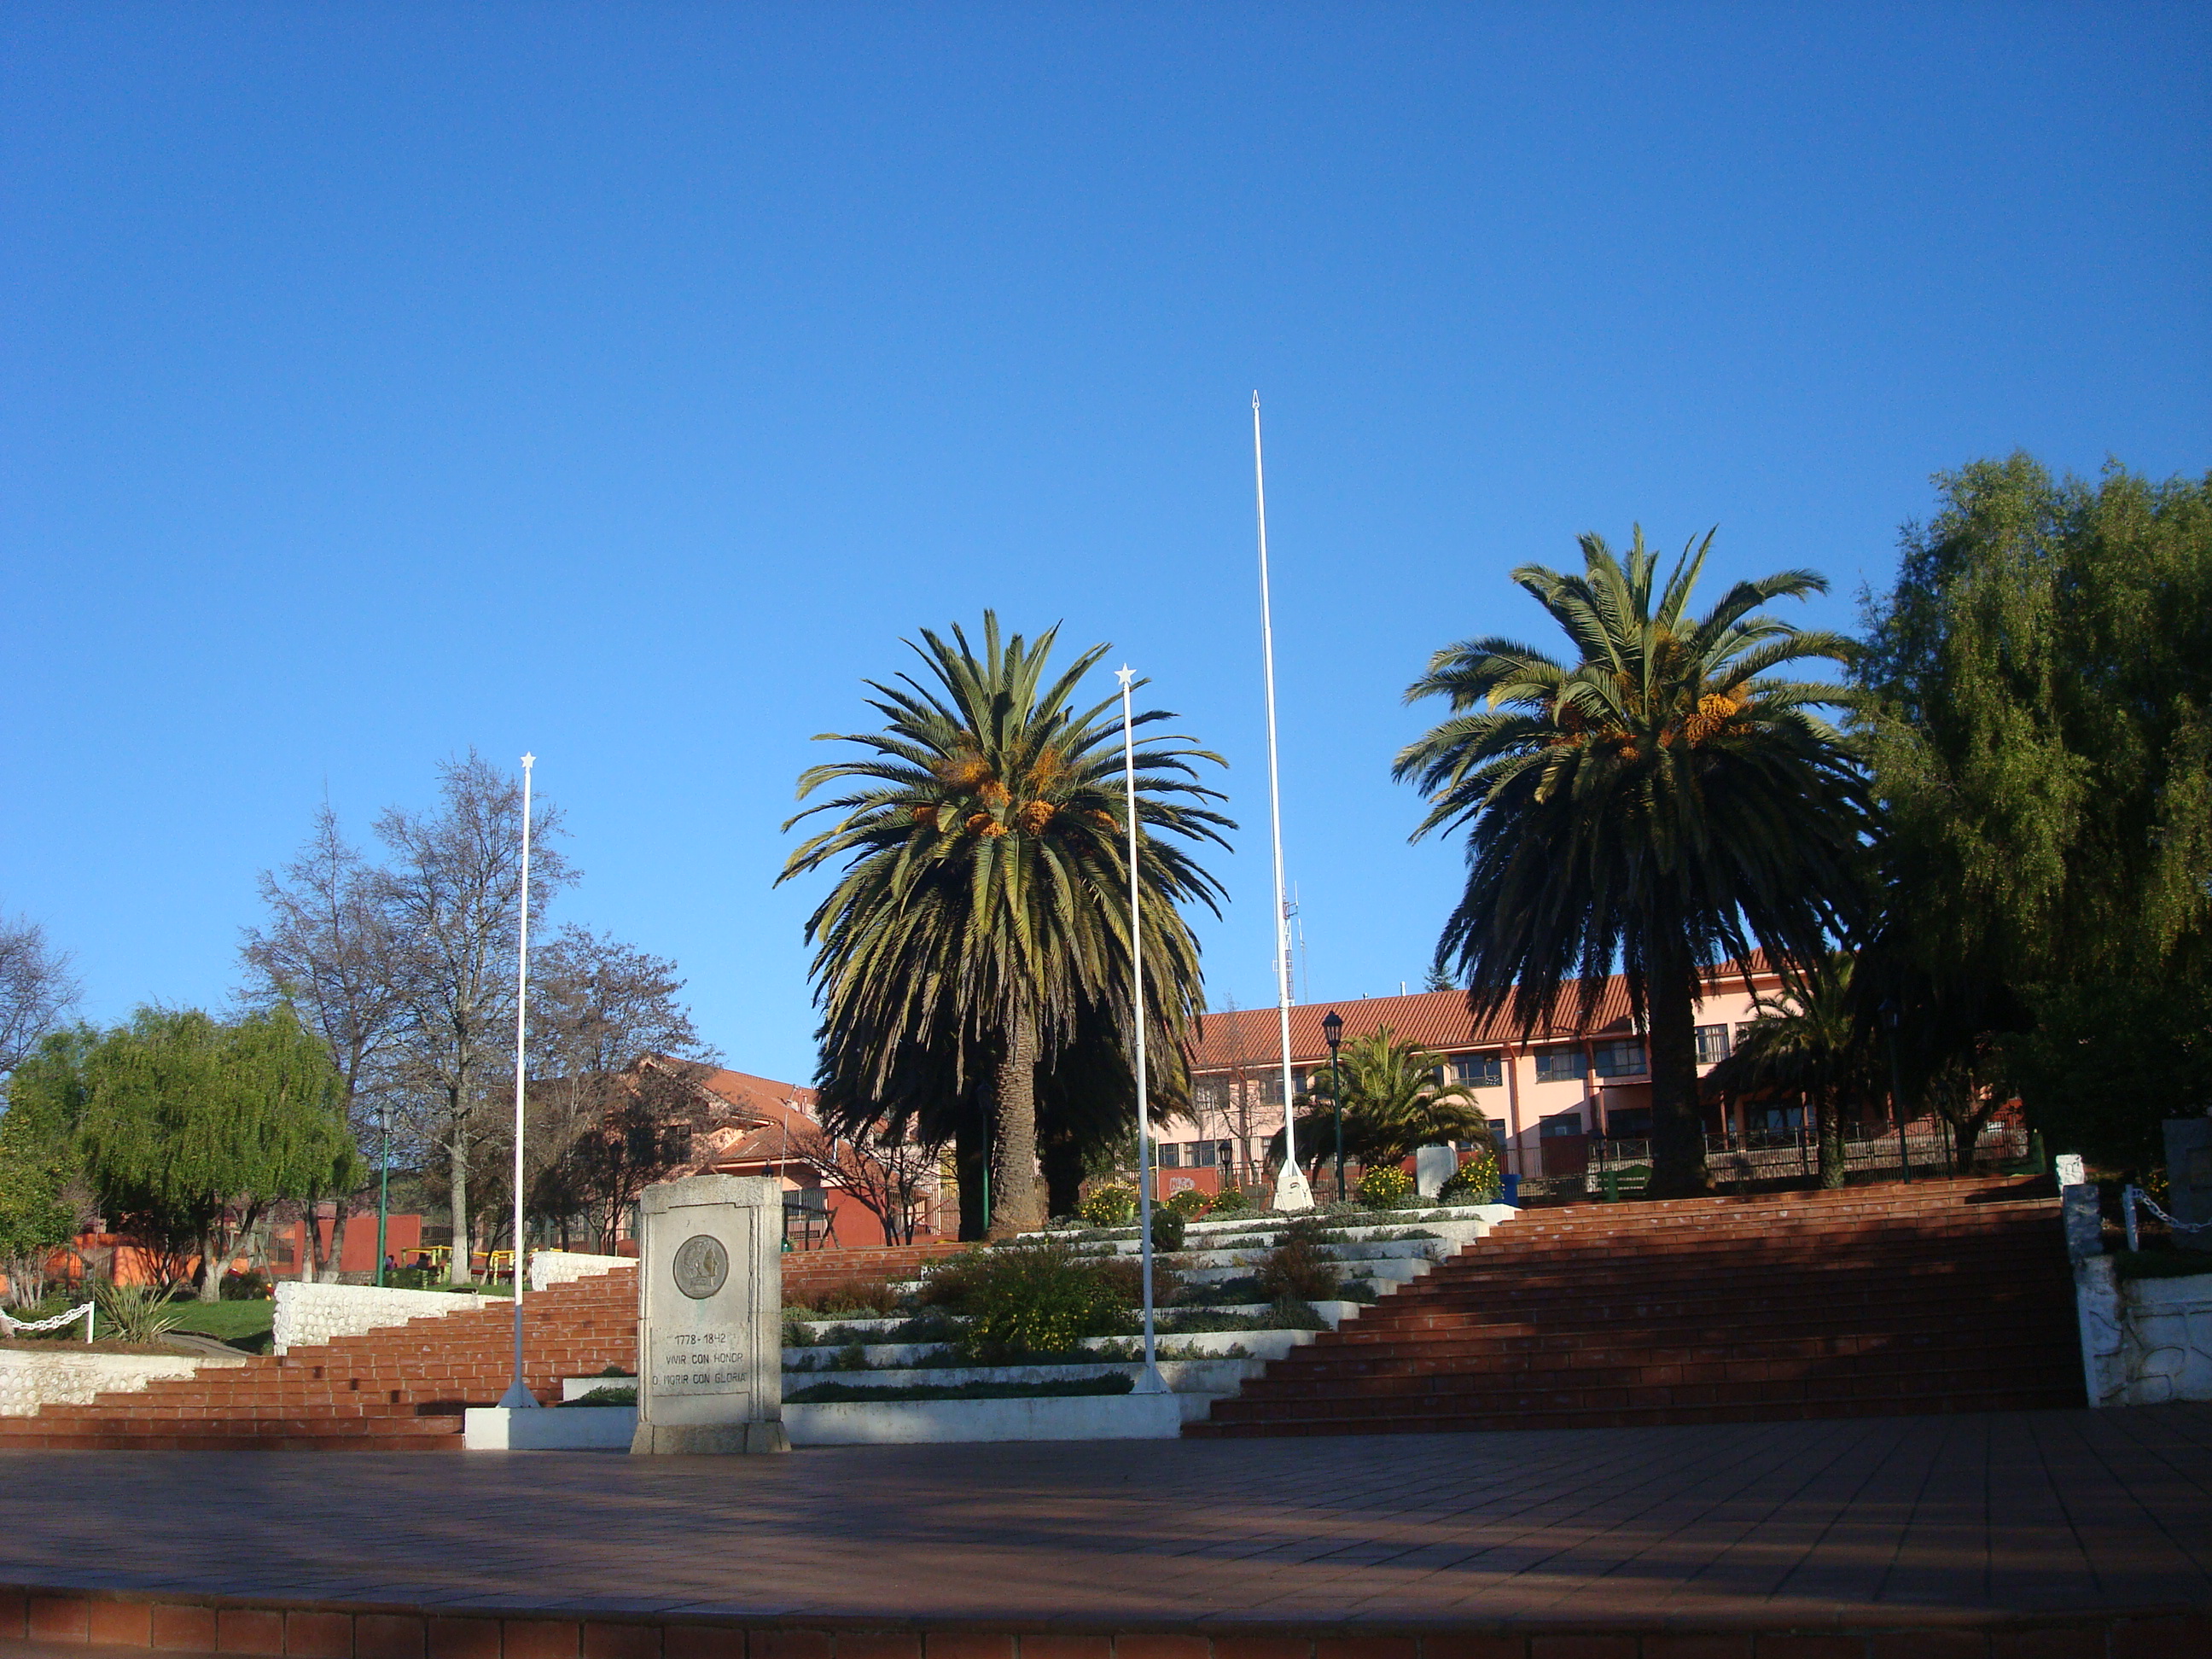
Bulnes
Bulnes is een gemeente in de Chileense provincie Ñuble in de regio Biobío. Bulnes telde 20.763 inwoners in 2012 en heeft een oppervlakte van 425 km².
Bulnes Wikipedia Page
Over onze gegevens
De gegevens op deze pagina zijn geschat met behulp van diverse openbaar beschikbare tools en bronnen. Ze worden aangeboden zonder garantie en kunnen onnauwkeurigheden bevatten. Gebruik op eigen risico.