Categorieën in Bindki
Industries
Bedrijfsdistributie per sector in Bindki
| Industrie omschrijving | Aantal bedrijven |
|---|---|
| Winkelen | 238 |
| Winkelen Overig | 164 |
| Onderwijs | 129 |
| Hindoetempel | 124 |
| Electronicawinkel | 99 |
| Kledingwinkels | 90 |
| Restaurants | 77 |
| Buurtwinkels en supermarkten | 71 |
| Apotheken | 57 |
| Ijzerhandel | 53 |
| Telecomwinkel | 50 |
Feiten over Bindki
| Gebied | 1165.9 km² |
| Bevolking | 921.777 |
| Mannelijke bevolking | 486.768 (52.8%) |
| Vrouwelijke bevolking | 435.009 (47.2%) |
| Bevolkingsverandering (1975 to 2020) | +153.5% |
| Bevolkingsverandering (2000 to 2020) | +31.1% |
| Gemiddelde leeftijd | 22.5 jaar (Man: 22.2, Vrouw: 22.8) |
| Netnummers | 5181 |
| Buurten | Gandhi Chauraha, Meerakhpur, Gandhi Chauraha, Azad Nagar, Khoya Bazar, Gandhi Chauraha, Transport Nagar |
| Lokale tijd | |
| Tijdzone | Indiase tijd |
| Breedte- & lengtegraad | 26.03613, 80.57617 |
| Postcodes | 212635 |
Kaart van Bindki
Interactieve kaart
Bevolking van Bindki
Jaren 1975 tot 2020
| Data | 1975 | 1990 | 2000 | 2015 | 2020 |
|---|---|---|---|---|---|
| Bevolking | 363.649 | 550.776 | 703.353 | 864.260 | 921.777 |
| Bevolkingsdichtheid | 311,9 / km² | 472,4 / km² | 603,3 / km² | 741,3 / km² | 790,6 / km² |
Bevolkingsverandering van Bindki van 2000 tot 2015
Stijging van 22.9% van jaar 2000 tot 2015
| Locatie | Verandering sinds 1975 | Verandering sinds 1990 | Verandering sinds 2000 |
|---|---|---|---|
| Bindki | +137.7% | +56.9% | +22.9% |
| Uttar Pradesh | +134.1% | +59.5% | +28.4% |
| India | +111.1% | +50.6% | +24.5% |
Mediane leeftijd in Bindki
Mediane leeftijd: 22.5 jaar
| Locatie | Gemiddelde leeftijd | Mediane leeftijd (vrouw) | Mediane leeftijd (mannelijk) |
|---|---|---|---|
| Bindki | 22.5 yrs | 22.8 yrs | 22.2 yrs |
| Uttar Pradesh | 21.4 yrs | 21.7 yrs | 21 yrs |
| India | 24.9 yrs | 25.4 yrs | 24.5 yrs |
Bevolkingsdichtheid van Bindki
Bevolkingsdichtheid: 791 / km²
| Locatie | Bevolking | Gebied | Dichtheid |
|---|---|---|---|
| Bindki | 921.777 | 1.165,9 km² | 791 / km² |
| Uttar Pradesh | 217,8 million | 240.777,3 km² | 905 / km² |
| India | 1.307 million | 3.083.563,4 km² | 424 / km² |
Historische en geprojecteerde bevolking van Bindki
Geschatte bevolking van 0 tot 2100
- JRC (European Commission's Joint Research Centre) werken aan de GHS built-up grid
- CIESIN (Center for International Earth Science Information Network)
- [Link] Klein Goldewijk, K., Beusen, A., Doelman, J., and Stehfest, E.: Anthropogenic land use estimates for the Holocene – HYDE 3.2, Earth Syst. Sci. Data, 9, 927–953, https://doi.org/10.5194/essd-9-927-2017, 2017.
Wijken in Bindki
Percentage bedrijven per wijk in Bindki
Netnummers
Percentage gebiedscodes gebruikt door bedrijven in Bindki
Human Development Index (HDI)
Statistische samengestelde index van levensverwachting, opleiding en inkomen per hoofd van de bevolking.
CO2-uitstoot van Bindki
Kooldioxide (CO2) -emissies per hoofd van de bevolking in ton per jaar
| Locatie | CO2 uitstoot | CO2-uitstoot per hoofd van de bevolking | CO2-emissie-intensiteit |
|---|---|---|---|
| Bindki | 1,014,262 tn | 1.1 tn | 870 tons/km² |
| Uttar Pradesh | 259,048,938 tn | 1.19 tn | 1,075.9 tons/km² |
| India | 1,928,568,344 tn | 1.48 tn | 625.4 tons/km² |
| CO2-uitstoot 2013 (ton/jaar) | 1,014,262 tn |
| CO2-uitstoot 2013 (ton/jaar) per hoofd van de bevolking | 1.1 tn |
| CO2-uitstootintensiteit 2013 (ton/km²/jaar) | 870 tons/km² |
Natuurlijk gevarenrisico
Relative risk out of 10
| Gevaar | Risk Level |
|---|---|
| Drought | Medium (7) |
| Flood | High (9) |
| Earthquake | Low (2) |
* Risk, particularly concerning flood or landslide, may not be for the entire area.
- Dilley, M., R.S. Chen, U. Deichmann, A.L. Lerner-Lam, M. Arnold, J. Agwe, P. Buys, O. Kjekstad, B. Lyon, and G. Yetman. 2005. Natural Disaster Hotspots: A Global Risk Analysis. Washington, D.C.: World Bank. https://doi.org/10.1596/0-8213-5930-4.
- Center for Hazards and Risk Research - CHRR - Columbia University, Center for International Earth Science Information Network - CIESIN - Columbia University, and International Research Institute for Climate and Society - IRI - Columbia University. 2005. Global Drought Hazard Frequency and Distribution. Palisades, NY: NASA Socioeconomic Data and Applications Center (SEDAC). https://doi.org/10.7927/H4VX0DFT.
- Center for Hazards and Risk Research - CHRR - Columbia University, Center for International Earth Science Information Network - CIESIN - Columbia University. 2005. Global Flood Hazard Frequency and Distribution. Palisades, NY: NASA Socioeconomic Data and Applications Center (SEDAC). https://doi.org/10.7927/H4668B3D.
- Center for Hazards and Risk Research - CHRR - Columbia University, Center for International Earth Science Information Network - CIESIN - Columbia University. 2005. Global Earthquake Hazard Distribution - Peak Ground Acceleration. Palisades, NY: NASA Socioeconomic Data and Applications Center (SEDAC). https://doi.org/10.7927/H4BZ63ZS.
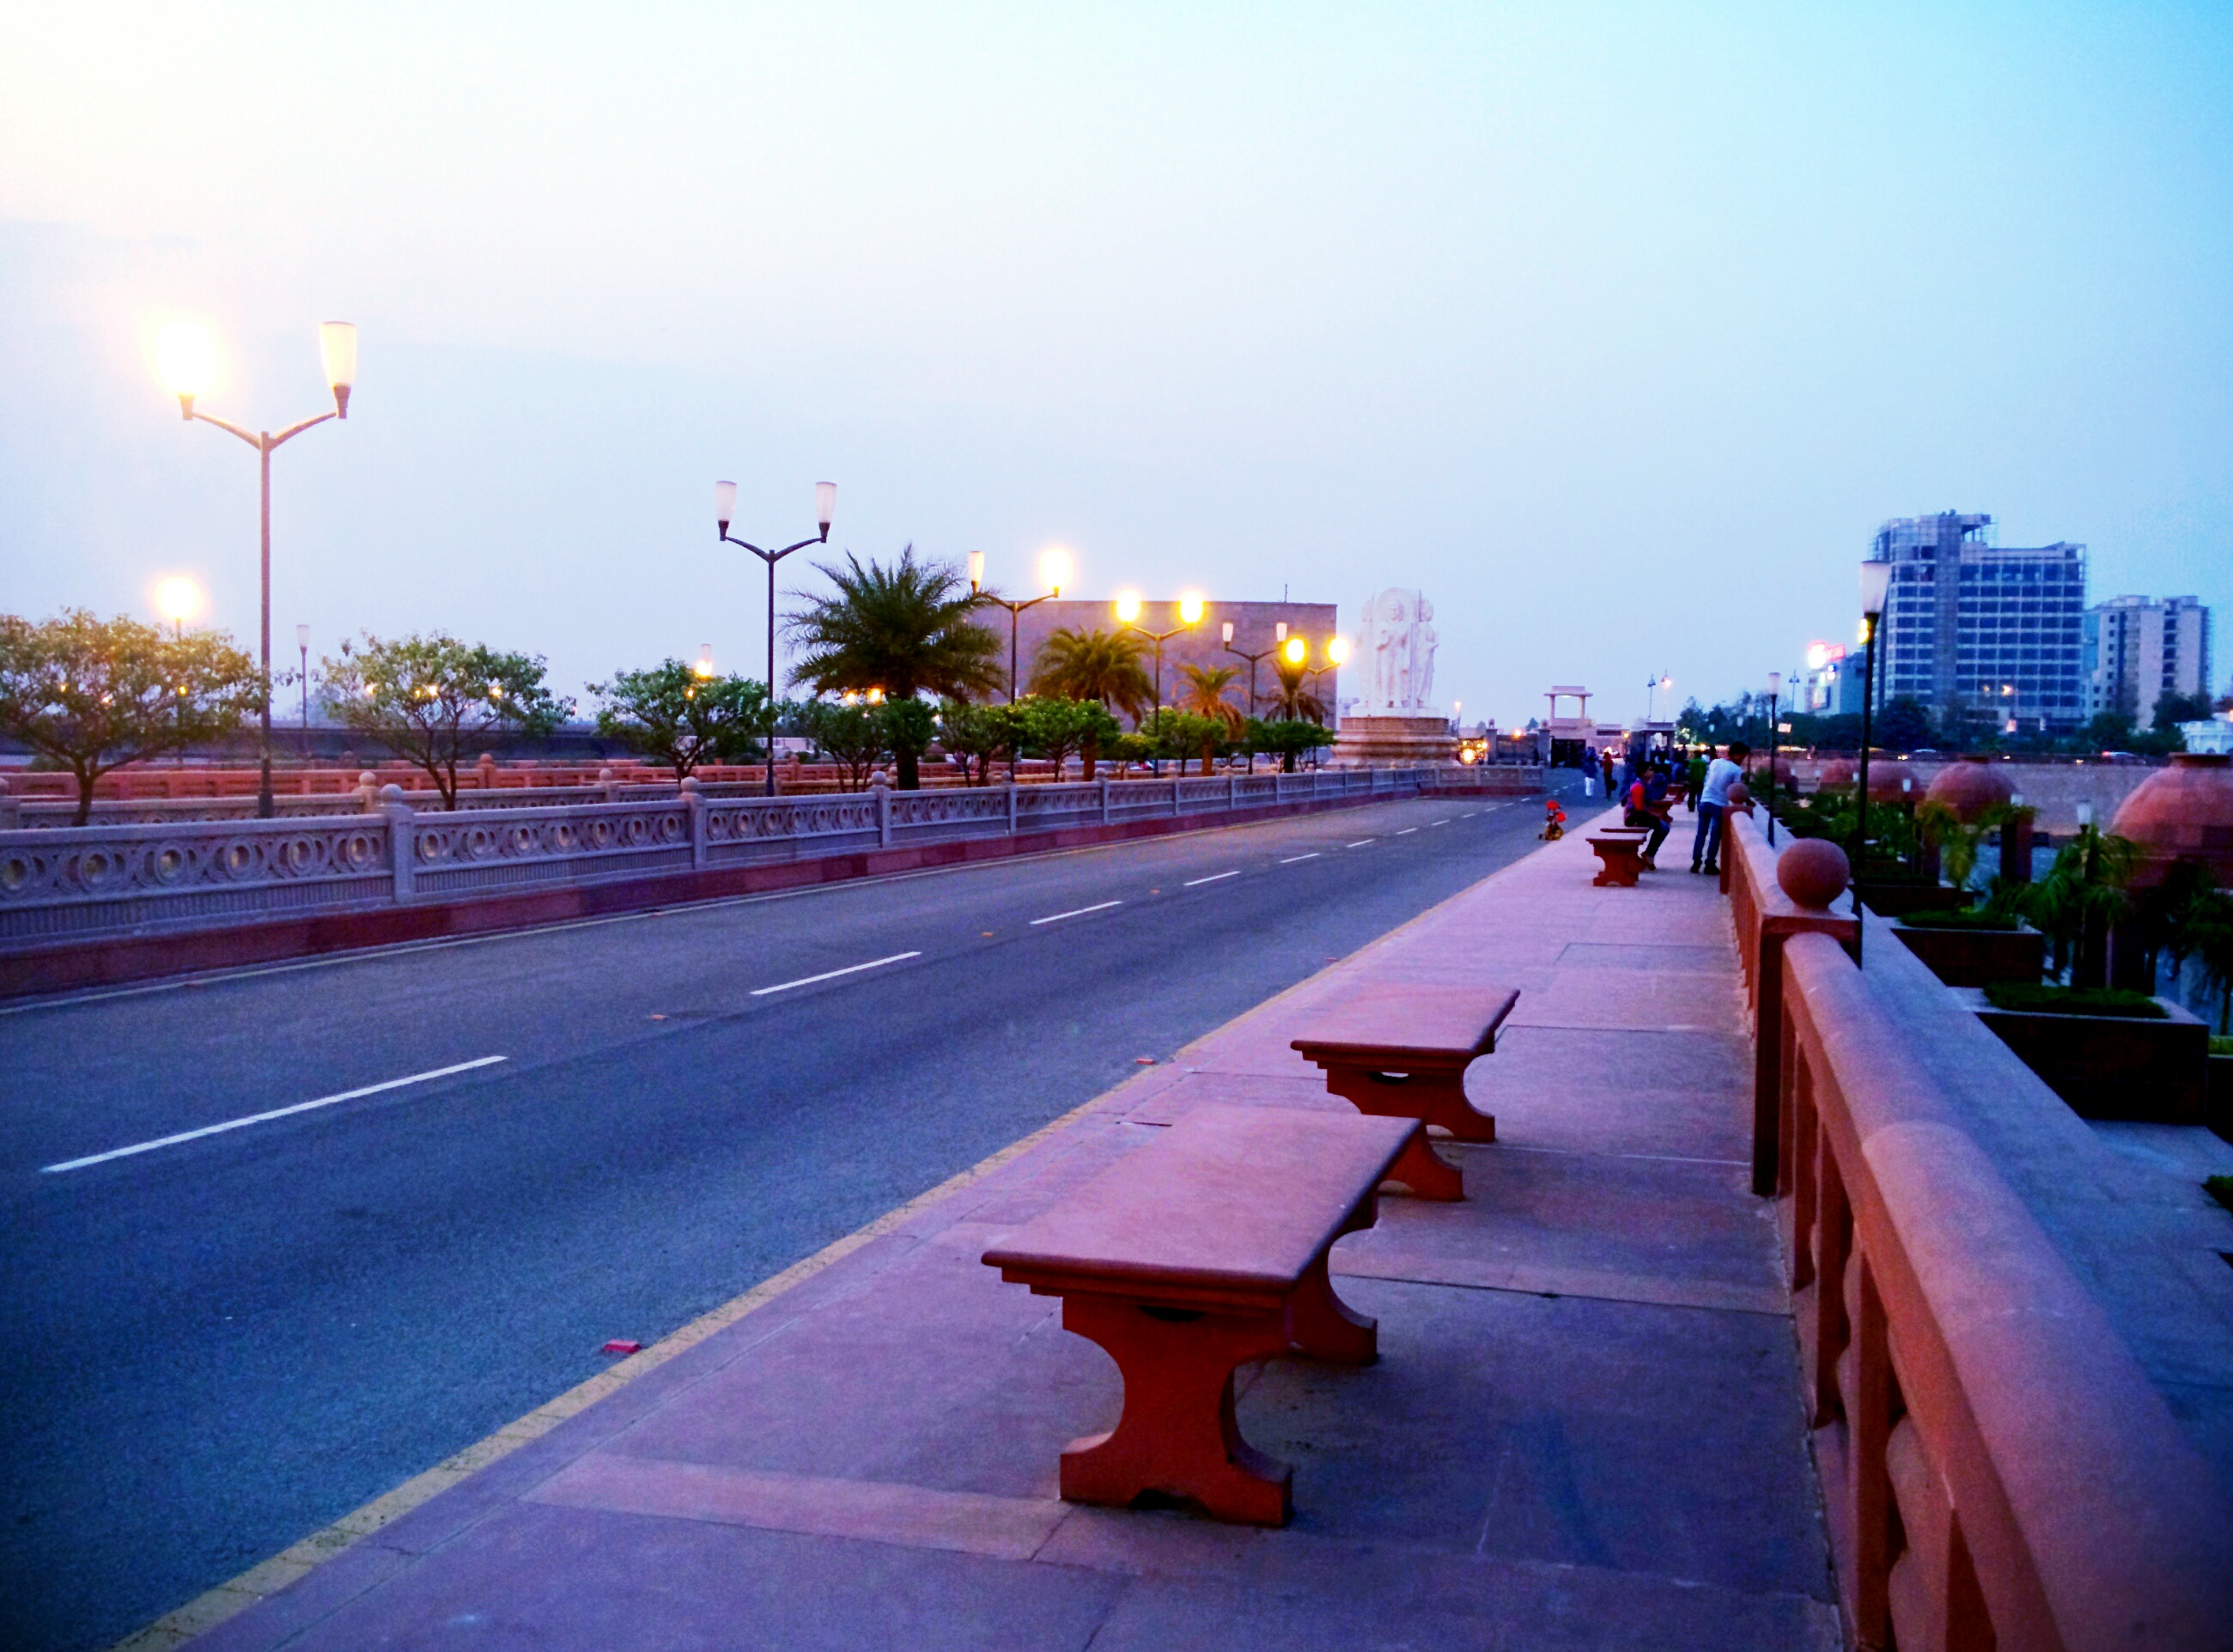
Bindki
Bindki is een stad en gemeente in het district Fatehpur van de Indiase staat Uttar Pradesh.
Bindki Wikipedia Page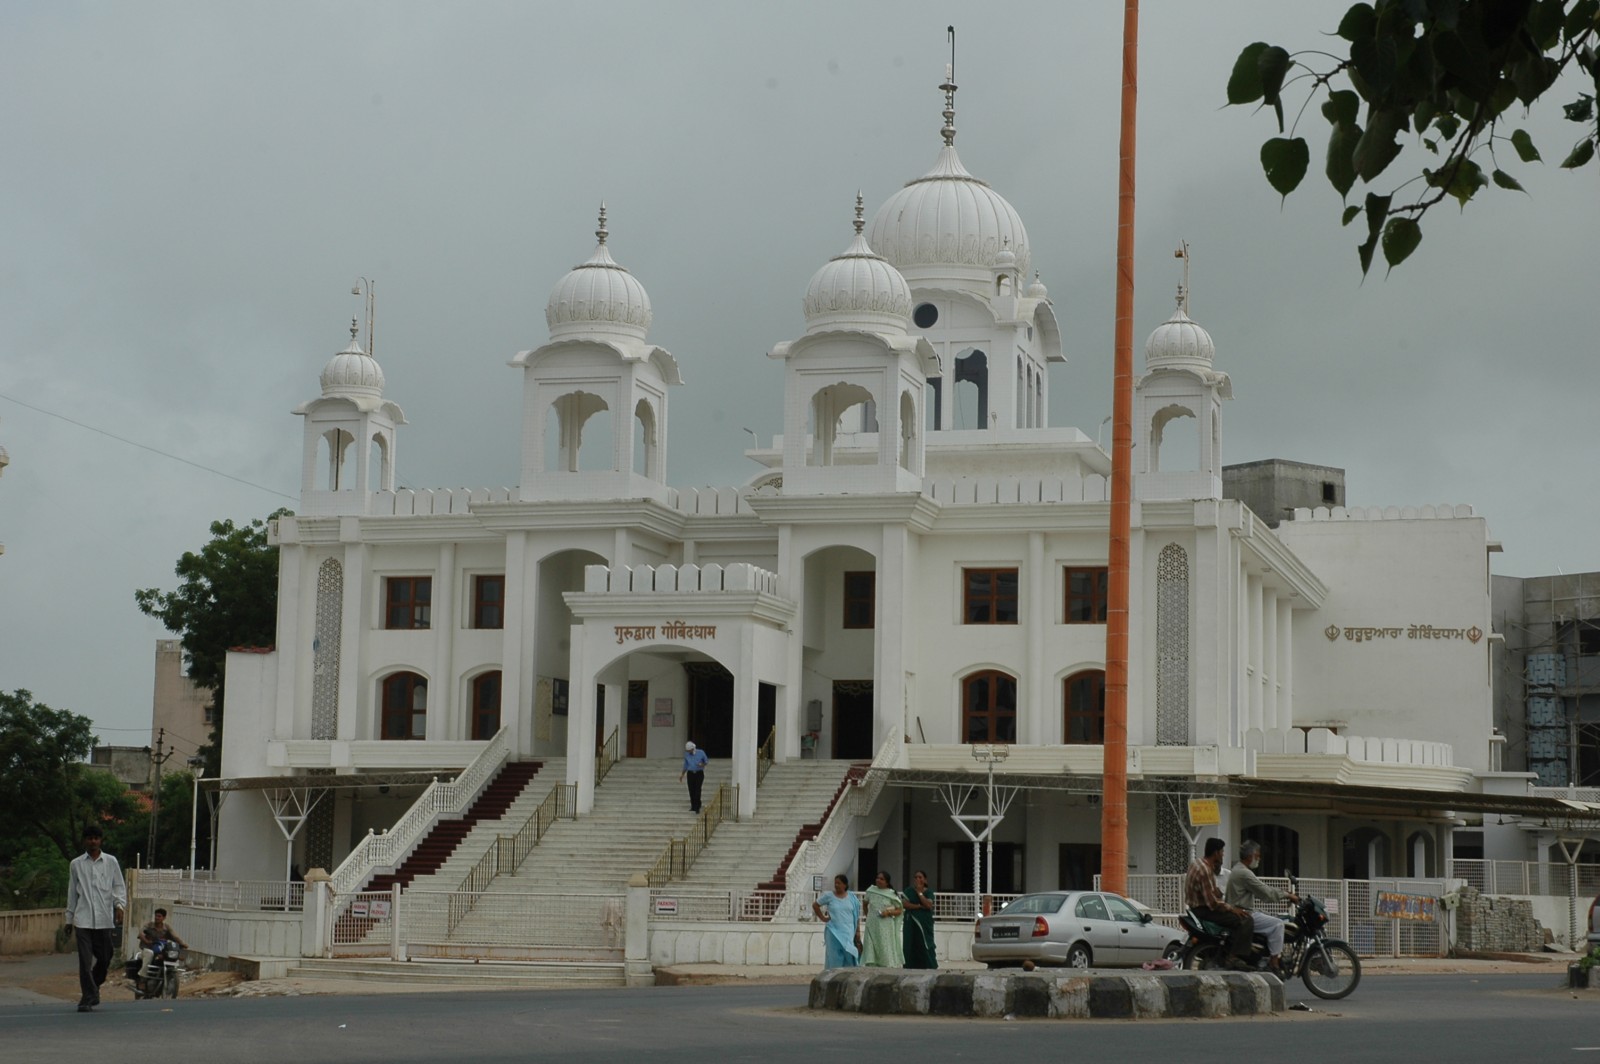

Over onze gegevens
De gegevens op deze pagina zijn geschat met behulp van diverse openbaar beschikbare tools en bronnen. Ze worden aangeboden zonder garantie en kunnen onnauwkeurigheden bevatten. Gebruik op eigen risico.