Categorieën in Mauda
AutogarageAutomaterialen winkelTankstationGroothandelelarenLandbouwMeststoffenleverancierTractordealerHerenkledingJuweliers en HorlogesKledingwinkelsSchoenenwinkelsTelecomwinkelHindoetempelOverheidsinstellingReligie (Geloof)Religieuze bestemmingElektronica winkelMobiele telefoon reparatiewinkelBouw van gebouwenIjzerhandelWinkel voor elektrische apparatuurWoningbouwWoningbouwprojectWoonwinkelHoger onderwijsOnderwijsOnderwijscentrumOnderwijsinstellingThuishulpFotostudioToeristische attractieBakkerijenBars en café'sBuurtwinkels en supermarktenCafé'sFamilierestaurantFastfoodrestaurantsFoodcourtFruit- en groentewinkelInternetcafé'sKoffieshopRestaurantsKleermakerBankenFinanciële instellingPIN-automatenMedische kliniekZiekenhuizenBarbierKapsalonSchoonheidsalonsFlatWooncomplexAlgemene winkelApotheekIndiase kruidenierswinkelSupermarktTabakswinkelTheewinkelWinkelcentrumWinkelenSpeeltuinenStadsparkenHotels en motelsMagazijnVervoerWoningbouwverenigingOnbereikbaar
Industries
Bedrijfsdistributie per sector in Mauda
| Industrie omschrijving | Aantal bedrijven |
|---|---|
| Restaurants | 38 |
| Winkelen | 34 |
| Onderwijs | 28 |
| Buurtwinkels en supermarkten | 27 |
| Electronicawinkel | 27 |
| Kledingwinkels | 25 |
| Ijzerhandel | 21 |
| Winkelen Overig | 17 |
| Apotheken | 15 |
| Reizen en transport | 14 |
| Ziekenhuizen | 13 |
| Banken | 13 |
| Café's | 13 |
Feiten over Mauda
| Gebied | 520.9 km² |
| Bevolking | 145.646 |
| Mannelijke bevolking | 75.090 (51.6%) |
| Vrouwelijke bevolking | 70.556 (48.4%) |
| Bevolkingsverandering (1975 to 2020) | +170.5% |
| Bevolkingsverandering (2000 to 2020) | +34.2% |
| Gemiddelde leeftijd | 28.4 jaar (Man: 28.2, Vrouw: 28.6) |
| Netnummers | 7115 |
| Lokale tijd | |
| Tijdzone | Indiase tijd |
| Breedte- & lengtegraad | 21.14575, 79.39794 |
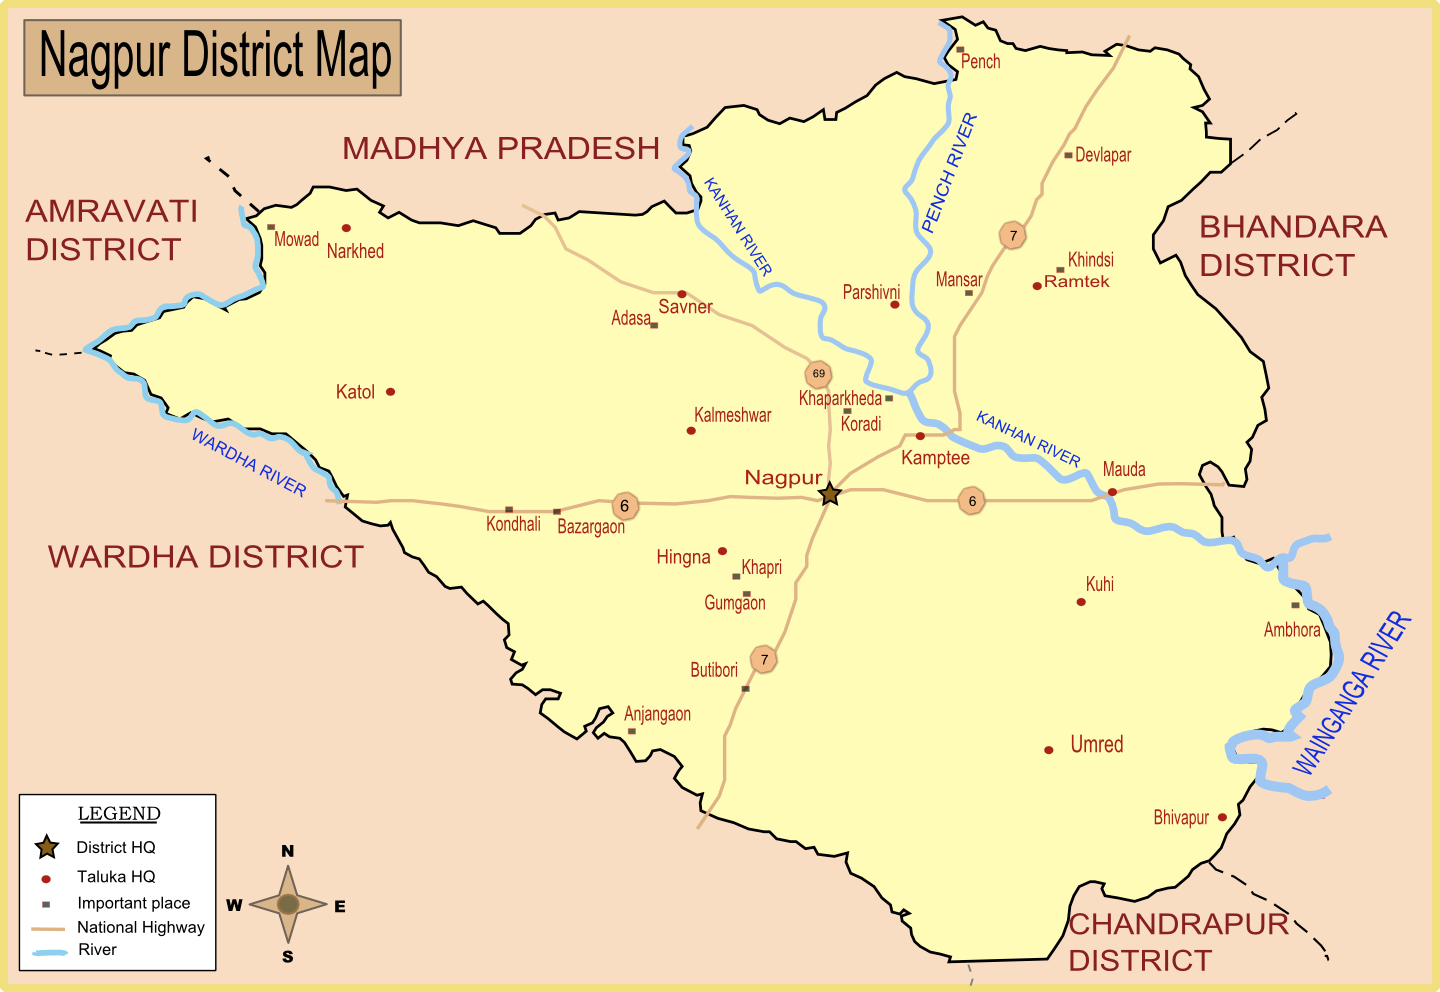
Kaart van Mauda
Interactieve kaart
Bevolking van Mauda
Jaren 1975 tot 2020
| Data | 1975 | 1990 | 2000 | 2015 | 2020 |
|---|---|---|---|---|---|
| Bevolking | 53.844 | 89.979 | 108.555 | 136.357 | 145.646 |
| Bevolkingsdichtheid | 103,4 / km² | 172,7 / km² | 208,4 / km² | 261,8 / km² | 279,6 / km² |
Bronnen: JRC (European Commission's Joint Research Centre) werken aan de GHS-bebouwingsraster
Bevolkingsverandering van Mauda van 2000 tot 2015
Stijging van 25.6% van jaar 2000 tot 2015
| Locatie | Verandering sinds 1975 | Verandering sinds 1990 | Verandering sinds 2000 |
|---|---|---|---|
| Mauda | +153.2% | +51.5% | +25.6% |
| Maharashtra | +98% | +45.2% | +21.9% |
| India | +111.1% | +50.6% | +24.5% |
Bronnen: JRC (European Commission's Joint Research Centre) werken aan de GHS-bebouwingsraster
Mediane leeftijd in Mauda
Mediane leeftijd: 28.4 jaar
| Locatie | Gemiddelde leeftijd | Mediane leeftijd (vrouw) | Mediane leeftijd (mannelijk) |
|---|---|---|---|
| Mauda | 28.4 yrs | 28.6 yrs | 28.2 yrs |
| Maharashtra | 27.2 yrs | 27.8 yrs | 26.6 yrs |
| India | 24.9 yrs | 25.4 yrs | 24.5 yrs |
Bronnen: CIESIN (Center for International Earth Science Information Network)
Bevolkingsdichtheid van Mauda
Bevolkingsdichtheid: 280 / km²
| Locatie | Bevolking | Gebied | Dichtheid |
|---|---|---|---|
| Mauda | 145.646 | 520,9 km² | 280 / km² |
| Maharashtra | 120,6 million | 307.683,7 km² | 392 / km² |
| India | 1.307 million | 3.083.563,4 km² | 424 / km² |
Bronnen: JRC (European Commission's Joint Research Centre) werken aan de GHS-bebouwingsraster
Historische en geprojecteerde bevolking van Mauda
Geschatte bevolking van 0 tot 2100
Bronnen:
- JRC (European Commission's Joint Research Centre) werken aan de GHS built-up grid
- CIESIN (Center for International Earth Science Information Network)
- [Link] Klein Goldewijk, K., Beusen, A., Doelman, J., and Stehfest, E.: Anthropogenic land use estimates for the Holocene – HYDE 3.2, Earth Syst. Sci. Data, 9, 927–953, https://doi.org/10.5194/essd-9-927-2017, 2017.
Human Development Index (HDI)
Statistische samengestelde index van levensverwachting, opleiding en inkomen per hoofd van de bevolking.
Bron: [Link] Kummu, M., Taka, M. &Guillaume, J. Gridded global datasets for Gross Domestic Product and Human Development Index over 1990–2015. Sci Data 5, 180004 (2018) doi:10.1038/sdata.2018.4
CO2-uitstoot van Mauda
Kooldioxide (CO2) -emissies per hoofd van de bevolking in ton per jaar
| Locatie | CO2 uitstoot | CO2-uitstoot per hoofd van de bevolking | CO2-emissie-intensiteit |
|---|---|---|---|
| Mauda | 327,398 tn | 2.25 tn | 628.5 tons/km² |
| Maharashtra | 206,036,744 tn | 1.71 tn | 669.6 tons/km² |
| India | 1,928,568,344 tn | 1.48 tn | 625.4 tons/km² |
Bronnen: [Link] Moran, D., Kanemoto K; Jiborn, M., Wood, R., Többen, J., and Seto, K.C. (2018) Carbon footprints of 13,000 cities. Environmental Research Letters DOI: 10.1088/1748-9326/aac72a
CO2-uitstoot van Mauda
| CO2-uitstoot 2013 (ton/jaar) | 327,398 tn |
| CO2-uitstoot 2013 (ton/jaar) per hoofd van de bevolking | 2.25 tn |
| CO2-uitstootintensiteit 2013 (ton/km²/jaar) | 628.5 tons/km² |
Natuurlijk gevarenrisico
Relative risk out of 10
| Gevaar | Risk Level |
|---|---|
| Drought | High (8) |
| Flood | Medium (4) |
* Risk, particularly concerning flood or landslide, may not be for the entire area.
Bronnen:
- Dilley, M., R.S. Chen, U. Deichmann, A.L. Lerner-Lam, M. Arnold, J. Agwe, P. Buys, O. Kjekstad, B. Lyon, and G. Yetman. 2005. Natural Disaster Hotspots: A Global Risk Analysis. Washington, D.C.: World Bank. https://doi.org/10.1596/0-8213-5930-4.
- Center for Hazards and Risk Research - CHRR - Columbia University, Center for International Earth Science Information Network - CIESIN - Columbia University, and International Research Institute for Climate and Society - IRI - Columbia University. 2005. Global Drought Hazard Frequency and Distribution. Palisades, NY: NASA Socioeconomic Data and Applications Center (SEDAC). https://doi.org/10.7927/H4VX0DFT.
- Center for Hazards and Risk Research - CHRR - Columbia University, Center for International Earth Science Information Network - CIESIN - Columbia University. 2005. Global Flood Hazard Frequency and Distribution. Palisades, NY: NASA Socioeconomic Data and Applications Center (SEDAC). https://doi.org/10.7927/H4668B3D.

Over onze gegevens
De gegevens op deze pagina zijn geschat met behulp van diverse openbaar beschikbare tools en bronnen. Ze worden aangeboden zonder garantie en kunnen onnauwkeurigheden bevatten. Gebruik op eigen risico.