Categorieën in Cingoli
Industries
Bedrijfsdistributie per sector in Cingoli
| Industrie omschrijving | Aantal bedrijven | Gemiddelde Google-beoordeling |
|---|---|---|
| Winkelen | 68 | 4.4 |
| Bouw van gebouwen | 37 | 4.5 |
| Algemene Aannemers | 33 | 4.6 |
| Overige accommodatie | 31 | 4.4 |
| Restaurants | 30 | 4.4 |
| Alle eten en drinken | 26 | 4.5 |
| Autogarage | 21 | 4.8 |
| Bars en café's | 21 | 4.5 |
| Buurtwinkels en supermarkten | 18 | 4.5 |
| Kerken | 17 | 4.4 |
| B&B's | 13 | 4.5 |
| Religie (Geloof) | 13 | 4.4 |
| Sport en vrije tijd | 12 | 4.4 |
| Technische bouwbedrijven | 11 | 5 |
| Hotels en motels | 9 | 4.3 |
| Postkantoor | 8 | 4 |
| Italiaanse restaurants | 8 | 4.4 |
| Schoonheidsalons | 8 | 4.8 |
| Openbaar bestuur | 8 | 4 |
| Kledingwinkels | 8 | 4 |
| Onderwijs | 8 | 3.8 |
| Reisbureaus | 7 | 4.4 |
| Elektrische installatie | 7 | 4 |
| Onroerend Goed | 7 | 4.3 |
| Kappers | 7 | 4.7 |
Feiten over Cingoli
| Gebied | 0.8 km² |
| Bevolking | 1.957 |
| Mannelijke bevolking | 978 (50.0%) |
| Vrouwelijke bevolking | 979 (50.0%) |
| Bevolkingsverandering (1975 to 2020) | +6.5% |
| Bevolkingsverandering (2000 to 2020) | +3.3% |
| Gemiddelde leeftijd | 36.8 jaar (Man: 35.9, Vrouw: 38) |
| Lokale tijd | |
| Tijdzone | Midden-Europese zomertijd |
| Breedte- & lengtegraad | 43.37573, 13.20787 |
Kaart van Cingoli
Interactieve kaart
Bevolking van Cingoli
Jaren 1975 tot 2020
| Data | 1975 | 1990 | 2000 | 2015 | 2020 |
|---|---|---|---|---|---|
| Bevolking | 1.837 | 1.901 | 1.895 | 1.967 | 1.957 |
| Bevolkingsdichtheid | 2.260,9 / km² | 2.339,7 / km² | 2.332,3 / km² | 2.420,9 / km² | 2.408,6 / km² |
Bevolkingsverandering van Cingoli van 2000 tot 2015
Stijging van 3.8% van jaar 2000 tot 2015
| Locatie | Verandering sinds 1975 | Verandering sinds 1990 | Verandering sinds 2000 |
|---|---|---|---|
| Cingoli | +7.1% | +3.5% | +3.8% |
| Italië | +8.3% | +4.9% | +4.7% |
Mediane leeftijd in Cingoli
Mediane leeftijd: 36.8 jaar
| Locatie | Gemiddelde leeftijd | Mediane leeftijd (vrouw) | Mediane leeftijd (mannelijk) |
|---|---|---|---|
| Cingoli | 36.8 yrs | 38 yrs | 35.9 yrs |
| Italië | 40.9 yrs | 41.5 yrs | 40.3 yrs |
Bevolkingsdichtheid van Cingoli
Bevolkingsdichtheid: 2.409 / km²
| Locatie | Bevolking | Gebied | Dichtheid |
|---|---|---|---|
| Cingoli | 1.957 | 0,813 km² | 2.409 / km² |
| Italië | 59,3 million | 301.510,7 km² | 197 / km² |
Historische en geprojecteerde bevolking van Cingoli
Geschatte bevolking van 0 tot 2100
- JRC (European Commission's Joint Research Centre) werken aan de GHS built-up grid
- CIESIN (Center for International Earth Science Information Network)
- [Link] Klein Goldewijk, K., Beusen, A., Doelman, J., and Stehfest, E.: Anthropogenic land use estimates for the Holocene – HYDE 3.2, Earth Syst. Sci. Data, 9, 927–953, https://doi.org/10.5194/essd-9-927-2017, 2017.
Netnummers
Percentage gebiedscodes gebruikt door bedrijven in Cingoli
Prijsverdeling
Bedrijfsspreiding voor Cingoli
Human Development Index (HDI)
Statistische samengestelde index van levensverwachting, opleiding en inkomen per hoofd van de bevolking.
CO2-uitstoot van Cingoli
Kooldioxide (CO2) -emissies per hoofd van de bevolking in ton per jaar
| Locatie | CO2 uitstoot | CO2-uitstoot per hoofd van de bevolking | CO2-emissie-intensiteit |
|---|---|---|---|
| Cingoli | 13,709 tn | 7.01 tn | 16,872.4 tons/km² |
| Italië | 399,008,505 tn | 6.73 tn | 1,323.4 tons/km² |
| CO2-uitstoot 2013 (ton/jaar) | 13,709 tn |
| CO2-uitstoot 2013 (ton/jaar) per hoofd van de bevolking | 7.01 tn |
| CO2-uitstootintensiteit 2013 (ton/km²/jaar) | 16,872.4 tons/km² |
Natuurlijk gevarenrisico
Relative risk out of 10
| Gevaar | Risk Level |
|---|---|
| Earthquake | Medium (6) |
| Landslide | Medium (6) |
* Risk, particularly concerning flood or landslide, may not be for the entire area.
- Dilley, M., R.S. Chen, U. Deichmann, A.L. Lerner-Lam, M. Arnold, J. Agwe, P. Buys, O. Kjekstad, B. Lyon, and G. Yetman. 2005. Natural Disaster Hotspots: A Global Risk Analysis. Washington, D.C.: World Bank. https://doi.org/10.1596/0-8213-5930-4.
- Center for Hazards and Risk Research - CHRR - Columbia University, Center for International Earth Science Information Network - CIESIN - Columbia University, and Norwegian Geotechnical Institute - NGI. 2005. Global Landslide Hazard Distribution. Palisades, NY: NASA Socioeconomic Data and Applications Center (SEDAC). https://doi.org/10.7927/H4P848VZ.
- Center for Hazards and Risk Research - CHRR - Columbia University, Center for International Earth Science Information Network - CIESIN - Columbia University. 2005. Global Earthquake Hazard Distribution - Peak Ground Acceleration. Palisades, NY: NASA Socioeconomic Data and Applications Center (SEDAC). https://doi.org/10.7927/H4BZ63ZS.
Recente aardbevingen in de buurt
Magnitude 3.0 en hoger
| Datum▼ | Tijd↕ | Magnitude↕ | Distance↕ | Diepte↕ | Locatie↕ | Link |
|---|---|---|---|---|---|---|
| 4/10/18 | 3:11 AM | 4.7 | 36.7 km | 10,000 m | 2km N of Pieve Torina, Italy | usgs.gov |
| 4/4/18 | 6:41 PM | 4 | 42.1 km | 10,000 m | 3km SW of Pieve Torina, Italy | usgs.gov |
| 4/4/18 | 2:19 AM | 4.1 | 39.3 km | 10,000 m | 3km WNW of Pieve Torina, Italy | usgs.gov |
| 11/3/16 | 12:35 AM | 4.8 | 40.7 km | 10,000 m | 2km W of Pieve Torina, Italy | usgs.gov |
| 11/1/16 | 7:56 AM | 4.9 | 41.9 km | 10,000 m | 9km NE of Visso, Italy | usgs.gov |
| 10/30/16 | 11:21 AM | 4.6 | 29.1 km | 10,000 m | 4km ESE of Camerino, Italy | usgs.gov |
| 10/27/16 | 12:21 AM | 4.2 | 42.9 km | 8,200 m | 7km SE of Pieve Torina, Italy | usgs.gov |
| 1/12/10 | 1:35 PM | 4.1 | 33.2 km | 24,100 m | central Italy | usgs.gov |
| 1/12/10 | 8:25 AM | 4.1 | 32.6 km | 25,600 m | central Italy | usgs.gov |
| 9/20/09 | 3:50 AM | 4.3 | 15.5 km | 37,700 m | central Italy | usgs.gov |
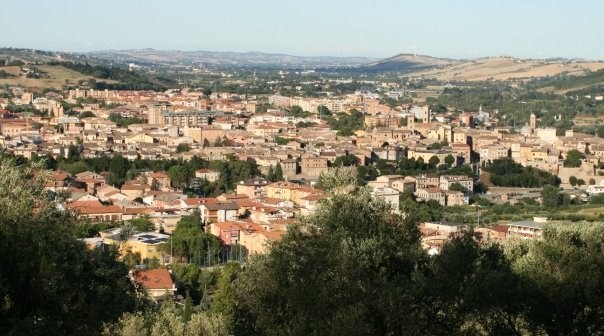
Cingoli
Cingoli is een gemeente in de Italiaanse provincie Macerata (regio Marche) en telt 10.554 inwoners (31-12-2004). De oppervlakte bedraagt 147,9 km², de bevolkingsdichtheid is 71 inwoners per km².
Cingoli Wikipedia Page


Over onze gegevens
De gegevens op deze pagina zijn geschat met behulp van diverse openbaar beschikbare tools en bronnen. Ze worden aangeboden zonder garantie en kunnen onnauwkeurigheden bevatten. Gebruik op eigen risico.