Categorieën in Itami
Industries
Bedrijfsdistributie per sector in Itami
| Industrie omschrijving | Aantal bedrijven |
|---|---|
| Bouw van gebouwen | 243 |
| Restaurants | 121 |
| Winkelen | 113 |
| Treinen en bussen | 77 |
| Kappers | 70 |
| Gemakswinkels | 47 |
| Medisch en gezondheid | 47 |
| Japanse restaurants | 46 |
Feiten over Itami
| Gebied | 46.9 km² |
| Bevolking | 363.666 |
| Mannelijke bevolking | 176.006 (48.4%) |
| Vrouwelijke bevolking | 187.660 (51.6%) |
| Bevolkingsverandering (1975 to 2020) | +12.8% |
| Bevolkingsverandering (2000 to 2020) | +0.8% |
| Gemiddelde leeftijd | 43 jaar (Man: 41.8, Vrouw: 44.2) |
| Netnummers | 6, 727 |
| Buurten | Nishidai, 1 Chome, Chuo, 1 Chome, Fujinoki, 1 Chome, Senzo, 1 Chome, Chuo, 4 Chome |
| Lokale tijd | |
| Tijdzone | Japanse standaardtijd |
| Breedte- & lengtegraad | 34.78427, 135.40126 |
| Postcodes | 561, 654, 664, 665, 666, More |
Kaart van Itami
Interactieve kaart
Bevolking van Itami
Jaren 1975 tot 2020
| Data | 1975 | 1990 | 2000 | 2015 | 2020 |
|---|---|---|---|---|---|
| Bevolking | 322.491 | 353.230 | 360.894 | 358.212 | 363.666 |
| Bevolkingsdichtheid | 6.870,6 / km² | 7.525,5 / km² | 7.688,8 / km² | 7.631,7 / km² | 7.747,9 / km² |
Bevolkingsverandering van Itami van 2000 tot 2015
Daling van 0.7% van jaar 2000 tot 2015
| Locatie | Verandering sinds 1975 | Verandering sinds 1990 | Verandering sinds 2000 |
|---|---|---|---|
| Itami | +11.1% | +1.4% | -0.7% |
| Hyogo (prefectuur) | +12.6% | +2.2% | -0.2% |
| Japan | +13.6% | +3.4% | +0.6% |
Mediane leeftijd in Itami
Mediane leeftijd: 43 jaar
| Locatie | Gemiddelde leeftijd | Mediane leeftijd (vrouw) | Mediane leeftijd (mannelijk) |
|---|---|---|---|
| Itami | 43 yrs | 44.2 yrs | 41.8 yrs |
| Hyogo (prefectuur) | 45 yrs | 46.5 yrs | 43.6 yrs |
| Japan | 45.1 yrs | 46.9 yrs | 43.5 yrs |
Bevolkingsdichtheid van Itami
Bevolkingsdichtheid: 7.748 / km²
| Locatie | Bevolking | Gebied | Dichtheid |
|---|---|---|---|
| Itami | 363.666 | 46,9 km² | 7.748 / km² |
| Hyogo (prefectuur) | 5,4 million | 8.396,6 km² | 645 / km² |
| Japan | 122,9 million | 373.410,9 km² | 329 / km² |
Historische en geprojecteerde bevolking van Itami
Geschatte bevolking van 1600 tot 2100
- JRC (European Commission's Joint Research Centre) werken aan de GHS built-up grid
- CIESIN (Center for International Earth Science Information Network)
- [Link] Klein Goldewijk, K., Beusen, A., Doelman, J., and Stehfest, E.: Anthropogenic land use estimates for the Holocene – HYDE 3.2, Earth Syst. Sci. Data, 9, 927–953, https://doi.org/10.5194/essd-9-927-2017, 2017.
Wijken in Itami
Percentage bedrijven per wijk in Itami
Prijsverdeling
Bedrijfsspreiding voor Itami
Human Development Index (HDI)
Statistische samengestelde index van levensverwachting, opleiding en inkomen per hoofd van de bevolking.
CO2-uitstoot van Itami
Kooldioxide (CO2) -emissies per hoofd van de bevolking in ton per jaar
| Locatie | CO2 uitstoot | CO2-uitstoot per hoofd van de bevolking | CO2-emissie-intensiteit |
|---|---|---|---|
| Itami | 303,638 tn | 0.83 tn | 6,469 tons/km² |
| Hyogo (prefectuur) | 5,432,186 tn | 1 tn | 647 tons/km² |
| Japan | 541,995,101 tn | 4.41 tn | 1,451.5 tons/km² |
| CO2-uitstoot 2013 (ton/jaar) | 303,638 tn |
| CO2-uitstoot 2013 (ton/jaar) per hoofd van de bevolking | 0.83 tn |
| CO2-uitstootintensiteit 2013 (ton/km²/jaar) | 6,469 tons/km² |
Natuurlijk gevarenrisico
Relative risk out of 10
| Gevaar | Risk Level |
|---|---|
| Flood | Medium (7) |
| Earthquake | High (8) |
| Cyclone | High (10) |
| Landslide | Medium (7) |
* Risk, particularly concerning flood or landslide, may not be for the entire area.
- Dilley, M., R.S. Chen, U. Deichmann, A.L. Lerner-Lam, M. Arnold, J. Agwe, P. Buys, O. Kjekstad, B. Lyon, and G. Yetman. 2005. Natural Disaster Hotspots: A Global Risk Analysis. Washington, D.C.: World Bank. https://doi.org/10.1596/0-8213-5930-4.
- Center for Hazards and Risk Research - CHRR - Columbia University, Center for International Earth Science Information Network - CIESIN - Columbia University, and Norwegian Geotechnical Institute - NGI. 2005. Global Landslide Hazard Distribution. Palisades, NY: NASA Socioeconomic Data and Applications Center (SEDAC). https://doi.org/10.7927/H4P848VZ.
- Center for Hazards and Risk Research - CHRR - Columbia University, Center for International Earth Science Information Network - CIESIN - Columbia University, International Bank for Reconstruction and Development - The World Bank, and United Nations Environment Programme Global Resource Information Database Geneva - UNEP/GRID-Geneva. 2005. Global Cyclone Hazard Frequency and Distribution. Palisades, NY: NASA Socioeconomic Data and Applications Center (SEDAC). https://doi.org/10.7927/H4CZ353K.
- Center for Hazards and Risk Research - CHRR - Columbia University, Center for International Earth Science Information Network - CIESIN - Columbia University. 2005. Global Flood Hazard Frequency and Distribution. Palisades, NY: NASA Socioeconomic Data and Applications Center (SEDAC). https://doi.org/10.7927/H4668B3D.
- Center for Hazards and Risk Research - CHRR - Columbia University, Center for International Earth Science Information Network - CIESIN - Columbia University. 2005. Global Earthquake Hazard Distribution - Peak Ground Acceleration. Palisades, NY: NASA Socioeconomic Data and Applications Center (SEDAC). https://doi.org/10.7927/H4BZ63ZS.
Recente aardbevingen in de buurt
Magnitude 3.0 en hoger
| Datum▼ | Tijd↕ | Magnitude↕ | Distance↕ | Diepte↕ | Locatie↕ | Link |
|---|---|---|---|---|---|---|
| 6/10/19 | 7:30 PM | 4.2 | 33.6 km | 366,200 m | 5km NW of Muko, Japan | usgs.gov |
| 7/8/18 | 6:45 AM | 3.8 | 24.8 km | 10,000 m | 4km SSW of Kameoka, Japan | usgs.gov |
| 6/23/18 | 2:08 PM | 3.9 | 25.1 km | 10,000 m | 2km NE of Hirakata, Japan | usgs.gov |
| 6/18/18 | 10:52 PM | 3.7 | 22.5 km | 10,000 m | 1km ENE of Neyagawa, Japan | usgs.gov |
| 6/18/18 | 3:31 PM | 4.6 | 19.1 km | 10,000 m | 2km NNW of Neyagawa, Japan | usgs.gov |
| 6/17/18 | 10:58 PM | 5.5 | 22.2 km | 10,340 m | 1km NW of Hirakata, Japan | usgs.gov |
| 3/31/16 | 5:54 AM | 4.1 | 60.4 km | 364,190 m | 25km SE of Maizuru, Japan | usgs.gov |
| 11/24/15 | 4:07 AM | 3.4 | 40.5 km | 10,000 m | 1km SW of Kyoto, Japan | usgs.gov |
| 11/17/14 | 9:07 PM | 4.3 | 37.6 km | 14,540 m | 8km ESE of Akashi, Japan | usgs.gov |
| 11/12/14 | 1:13 AM | 4.6 | 61.5 km | 62,380 m | 5km NNW of Koya, Japan | usgs.gov |
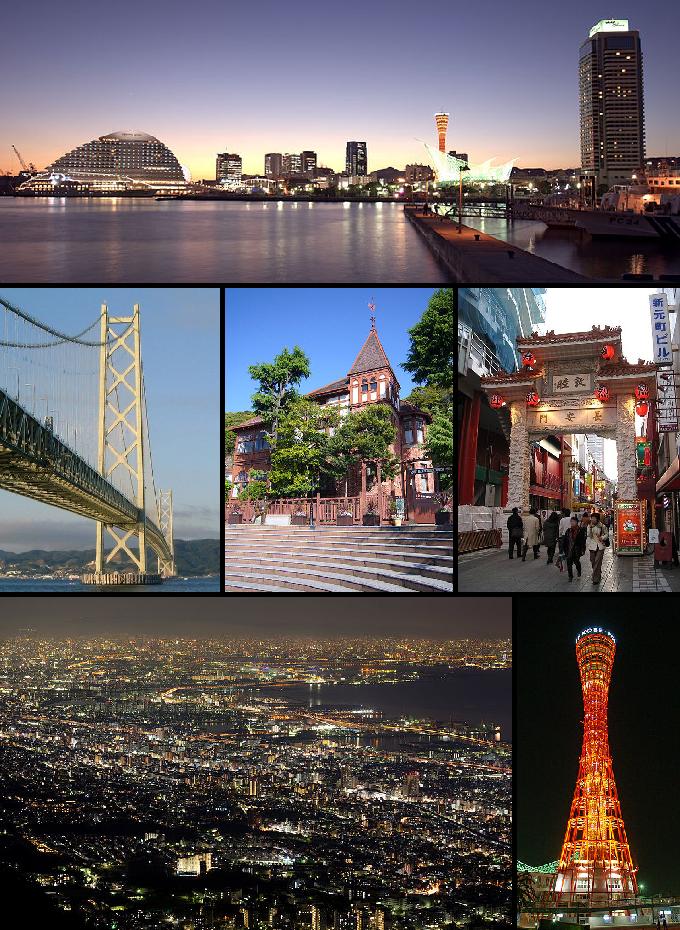
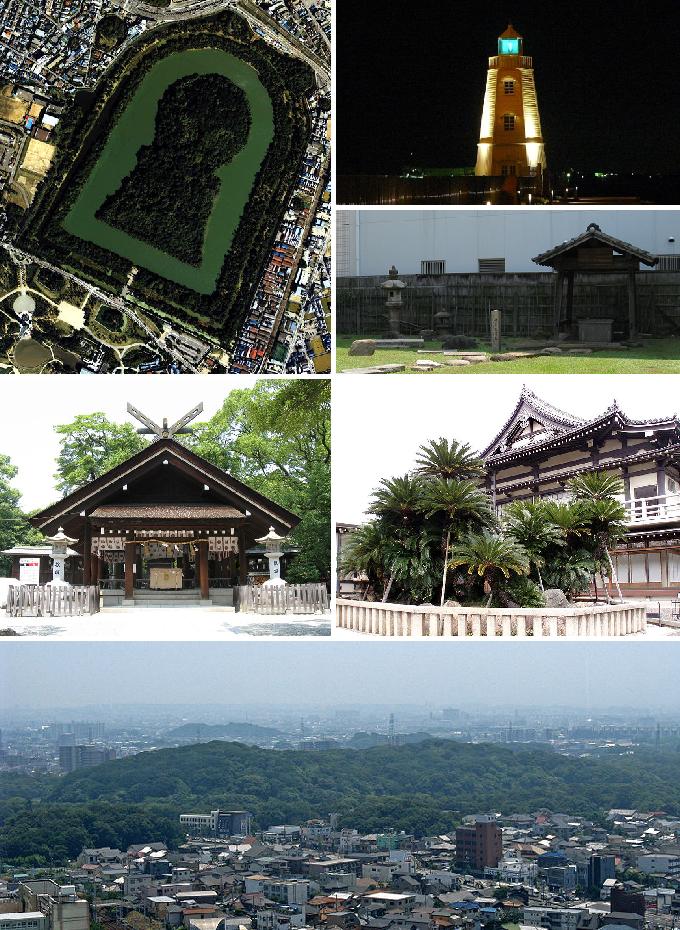
Itami
Itami (伊丹市, , Itami-shi) is een stad gelegen in de prefectuur Hyogo, Japan.
Itami Wikipedia Page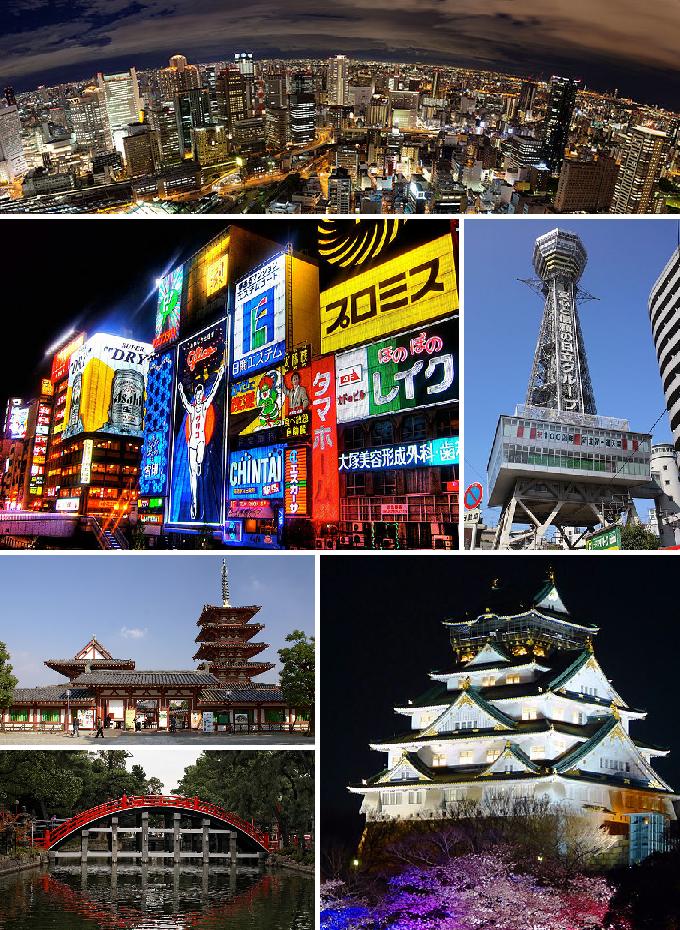
Over onze gegevens
De gegevens op deze pagina zijn geschat met behulp van diverse openbaar beschikbare tools en bronnen. Ze worden aangeboden zonder garantie en kunnen onnauwkeurigheden bevatten. Gebruik op eigen risico.