Categorieën in Capas
Industries
Bedrijfsdistributie per sector in Capas
| Industrie omschrijving | Aantal bedrijven |
|---|---|
| Restaurants | 167 |
| Winkelen | 156 |
| Reizen en transport | 87 |
| Kerken | 71 |
| Onderwijs | 67 |
| Café's | 64 |
| Buurtwinkels en supermarkten | 55 |
| Religie (Geloof) | 50 |
Feiten over Capas
| Gebied | 409.6 km² |
| Bevolking | 151.593 |
| Mannelijke bevolking | 77.821 (51.3%) |
| Vrouwelijke bevolking | 73.772 (48.7%) |
| Bevolkingsverandering (1975 to 2020) | +356.9% |
| Bevolkingsverandering (2000 to 2020) | +31.3% |
| Gemiddelde leeftijd | 22.4 jaar (Man: 21.9, Vrouw: 23) |
| Netnummers | 45 |
| Buurten | Santa Lucia, Cristo Rey, O'Donnell, Tarukan, Lawy |
| Lokale tijd | |
| Tijdzone | Filipijnse standaardtijd |
| Breedte- & lengtegraad | 15.33117, 120.58980 |
| Postcodes | 2333 |
Kaart van Capas
Interactieve kaart
Bevolking van Capas
Jaren 1975 tot 2020
| Data | 1975 | 1990 | 2000 | 2015 | 2020 |
|---|---|---|---|---|---|
| Bevolking | 33.176 | 81.343 | 115.493 | 139.141 | 151.593 |
| Bevolkingsdichtheid | 81 / km² | 198,6 / km² | 282 / km² | 339,7 / km² | 370,1 / km² |
Bevolkingsverandering van Capas van 2000 tot 2015
Stijging van 20.5% van jaar 2000 tot 2015
| Locatie | Verandering sinds 1975 | Verandering sinds 1990 | Verandering sinds 2000 |
|---|---|---|---|
| Capas | +319.4% | +71.1% | +20.5% |
| Filipijnen | +146.5% | +63.3% | +29.5% |
Mediane leeftijd in Capas
Mediane leeftijd: 22.4 jaar
| Locatie | Gemiddelde leeftijd | Mediane leeftijd (vrouw) | Mediane leeftijd (mannelijk) |
|---|---|---|---|
| Capas | 22.4 yrs | 23 yrs | 21.9 yrs |
| Filipijnen | 23.2 yrs | 23.6 yrs | 22.8 yrs |
Bevolkingsdichtheid van Capas
Bevolkingsdichtheid: 370 / km²
| Locatie | Bevolking | Gebied | Dichtheid |
|---|---|---|---|
| Capas | 151.593 | 409,6 km² | 370 / km² |
| Filipijnen | 96,6 million | 296.939,4 km² | 325 / km² |
Historische en geprojecteerde bevolking van Capas
Geschatte bevolking van 1810 tot 2100
- JRC (European Commission's Joint Research Centre) werken aan de GHS built-up grid
- CIESIN (Center for International Earth Science Information Network)
- [Link] Klein Goldewijk, K., Beusen, A., Doelman, J., and Stehfest, E.: Anthropogenic land use estimates for the Holocene – HYDE 3.2, Earth Syst. Sci. Data, 9, 927–953, https://doi.org/10.5194/essd-9-927-2017, 2017.
Wijken in Capas
Percentage bedrijven per wijk in Capas
Netnummers
Percentage gebiedscodes gebruikt door bedrijven in Capas
Prijsverdeling
Bedrijfsspreiding voor Capas
Human Development Index (HDI)
Statistische samengestelde index van levensverwachting, opleiding en inkomen per hoofd van de bevolking.
CO2-uitstoot van Capas
Kooldioxide (CO2) -emissies per hoofd van de bevolking in ton per jaar
| Locatie | CO2 uitstoot | CO2-uitstoot per hoofd van de bevolking | CO2-emissie-intensiteit |
|---|---|---|---|
| Capas | 193,734 tn | 1.28 tn | 473 tons/km² |
| Filipijnen | 104,920,564 tn | 1.09 tn | 353.3 tons/km² |
| CO2-uitstoot 2013 (ton/jaar) | 193,734 tn |
| CO2-uitstoot 2013 (ton/jaar) per hoofd van de bevolking | 1.28 tn |
| CO2-uitstootintensiteit 2013 (ton/km²/jaar) | 473 tons/km² |
Natuurlijk gevarenrisico
Relative risk out of 10
| Gevaar | Risk Level |
|---|---|
| Drought | Low (2) |
| Flood | High (10) |
| Earthquake | High (8) |
| Cyclone | High (10) |
| Landslide | High (8) |
* Risk, particularly concerning flood or landslide, may not be for the entire area.
- Dilley, M., R.S. Chen, U. Deichmann, A.L. Lerner-Lam, M. Arnold, J. Agwe, P. Buys, O. Kjekstad, B. Lyon, and G. Yetman. 2005. Natural Disaster Hotspots: A Global Risk Analysis. Washington, D.C.: World Bank. https://doi.org/10.1596/0-8213-5930-4.
- Center for Hazards and Risk Research - CHRR - Columbia University, Center for International Earth Science Information Network - CIESIN - Columbia University, and Norwegian Geotechnical Institute - NGI. 2005. Global Landslide Hazard Distribution. Palisades, NY: NASA Socioeconomic Data and Applications Center (SEDAC). https://doi.org/10.7927/H4P848VZ.
- Center for Hazards and Risk Research - CHRR - Columbia University, Center for International Earth Science Information Network - CIESIN - Columbia University, International Bank for Reconstruction and Development - The World Bank, and United Nations Environment Programme Global Resource Information Database Geneva - UNEP/GRID-Geneva. 2005. Global Cyclone Hazard Frequency and Distribution. Palisades, NY: NASA Socioeconomic Data and Applications Center (SEDAC). https://doi.org/10.7927/H4CZ353K.
- Center for Hazards and Risk Research - CHRR - Columbia University, Center for International Earth Science Information Network - CIESIN - Columbia University, and International Research Institute for Climate and Society - IRI - Columbia University. 2005. Global Drought Hazard Frequency and Distribution. Palisades, NY: NASA Socioeconomic Data and Applications Center (SEDAC). https://doi.org/10.7927/H4VX0DFT.
- Center for Hazards and Risk Research - CHRR - Columbia University, Center for International Earth Science Information Network - CIESIN - Columbia University. 2005. Global Flood Hazard Frequency and Distribution. Palisades, NY: NASA Socioeconomic Data and Applications Center (SEDAC). https://doi.org/10.7927/H4668B3D.
- Center for Hazards and Risk Research - CHRR - Columbia University, Center for International Earth Science Information Network - CIESIN - Columbia University. 2005. Global Earthquake Hazard Distribution - Peak Ground Acceleration. Palisades, NY: NASA Socioeconomic Data and Applications Center (SEDAC). https://doi.org/10.7927/H4BZ63ZS.
Recente aardbevingen in de buurt
Magnitude 3.0 en hoger
| Datum▼ | Tijd↕ | Magnitude↕ | Distance↕ | Diepte↕ | Locatie↕ | Link |
|---|---|---|---|---|---|---|
| 4/22/19 | 9:11 AM | 6.1 | 42.5 km | 21,840 m | 3km SSW of Floridablanca, Philippines | usgs.gov |
| 2/7/19 | 10:28 PM | 4.3 | 40.5 km | 156,490 m | 1km SSW of Maturanoc, Philippines | usgs.gov |
| 12/28/18 | 11:47 AM | 4.6 | 8.8 km | 165,920 m | 1km ESE of Concepcion, Philippines | usgs.gov |
| 5/25/17 | 2:27 PM | 5.3 | 40.9 km | 75,460 m | 15km ENE of Santa Fe, Philippines | usgs.gov |
| 12/15/15 | 12:12 AM | 4.1 | 37.1 km | 10,720 m | 1km SSW of San Juan, Philippines | usgs.gov |
| 10/2/14 | 4:13 PM | 4.7 | 27.2 km | 203,560 m | 3km WSW of Arayat, Philippines | usgs.gov |
| 6/29/14 | 10:25 PM | 4.1 | 30.6 km | 10,000 m | 13km WSW of Santa Juliana, Philippines | usgs.gov |
| 5/29/14 | 6:42 PM | 4.4 | 33.7 km | 130,970 m | 17km WSW of Santa Juliana, Philippines | usgs.gov |
| 3/13/13 | 6:49 PM | 4.3 | 29.6 km | 69,900 m | 7km NNE of Olongapo, Philippines | usgs.gov |
| 11/19/12 | 7:54 AM | 4.1 | 9 km | 158,800 m | Luzon, Philippines | usgs.gov |
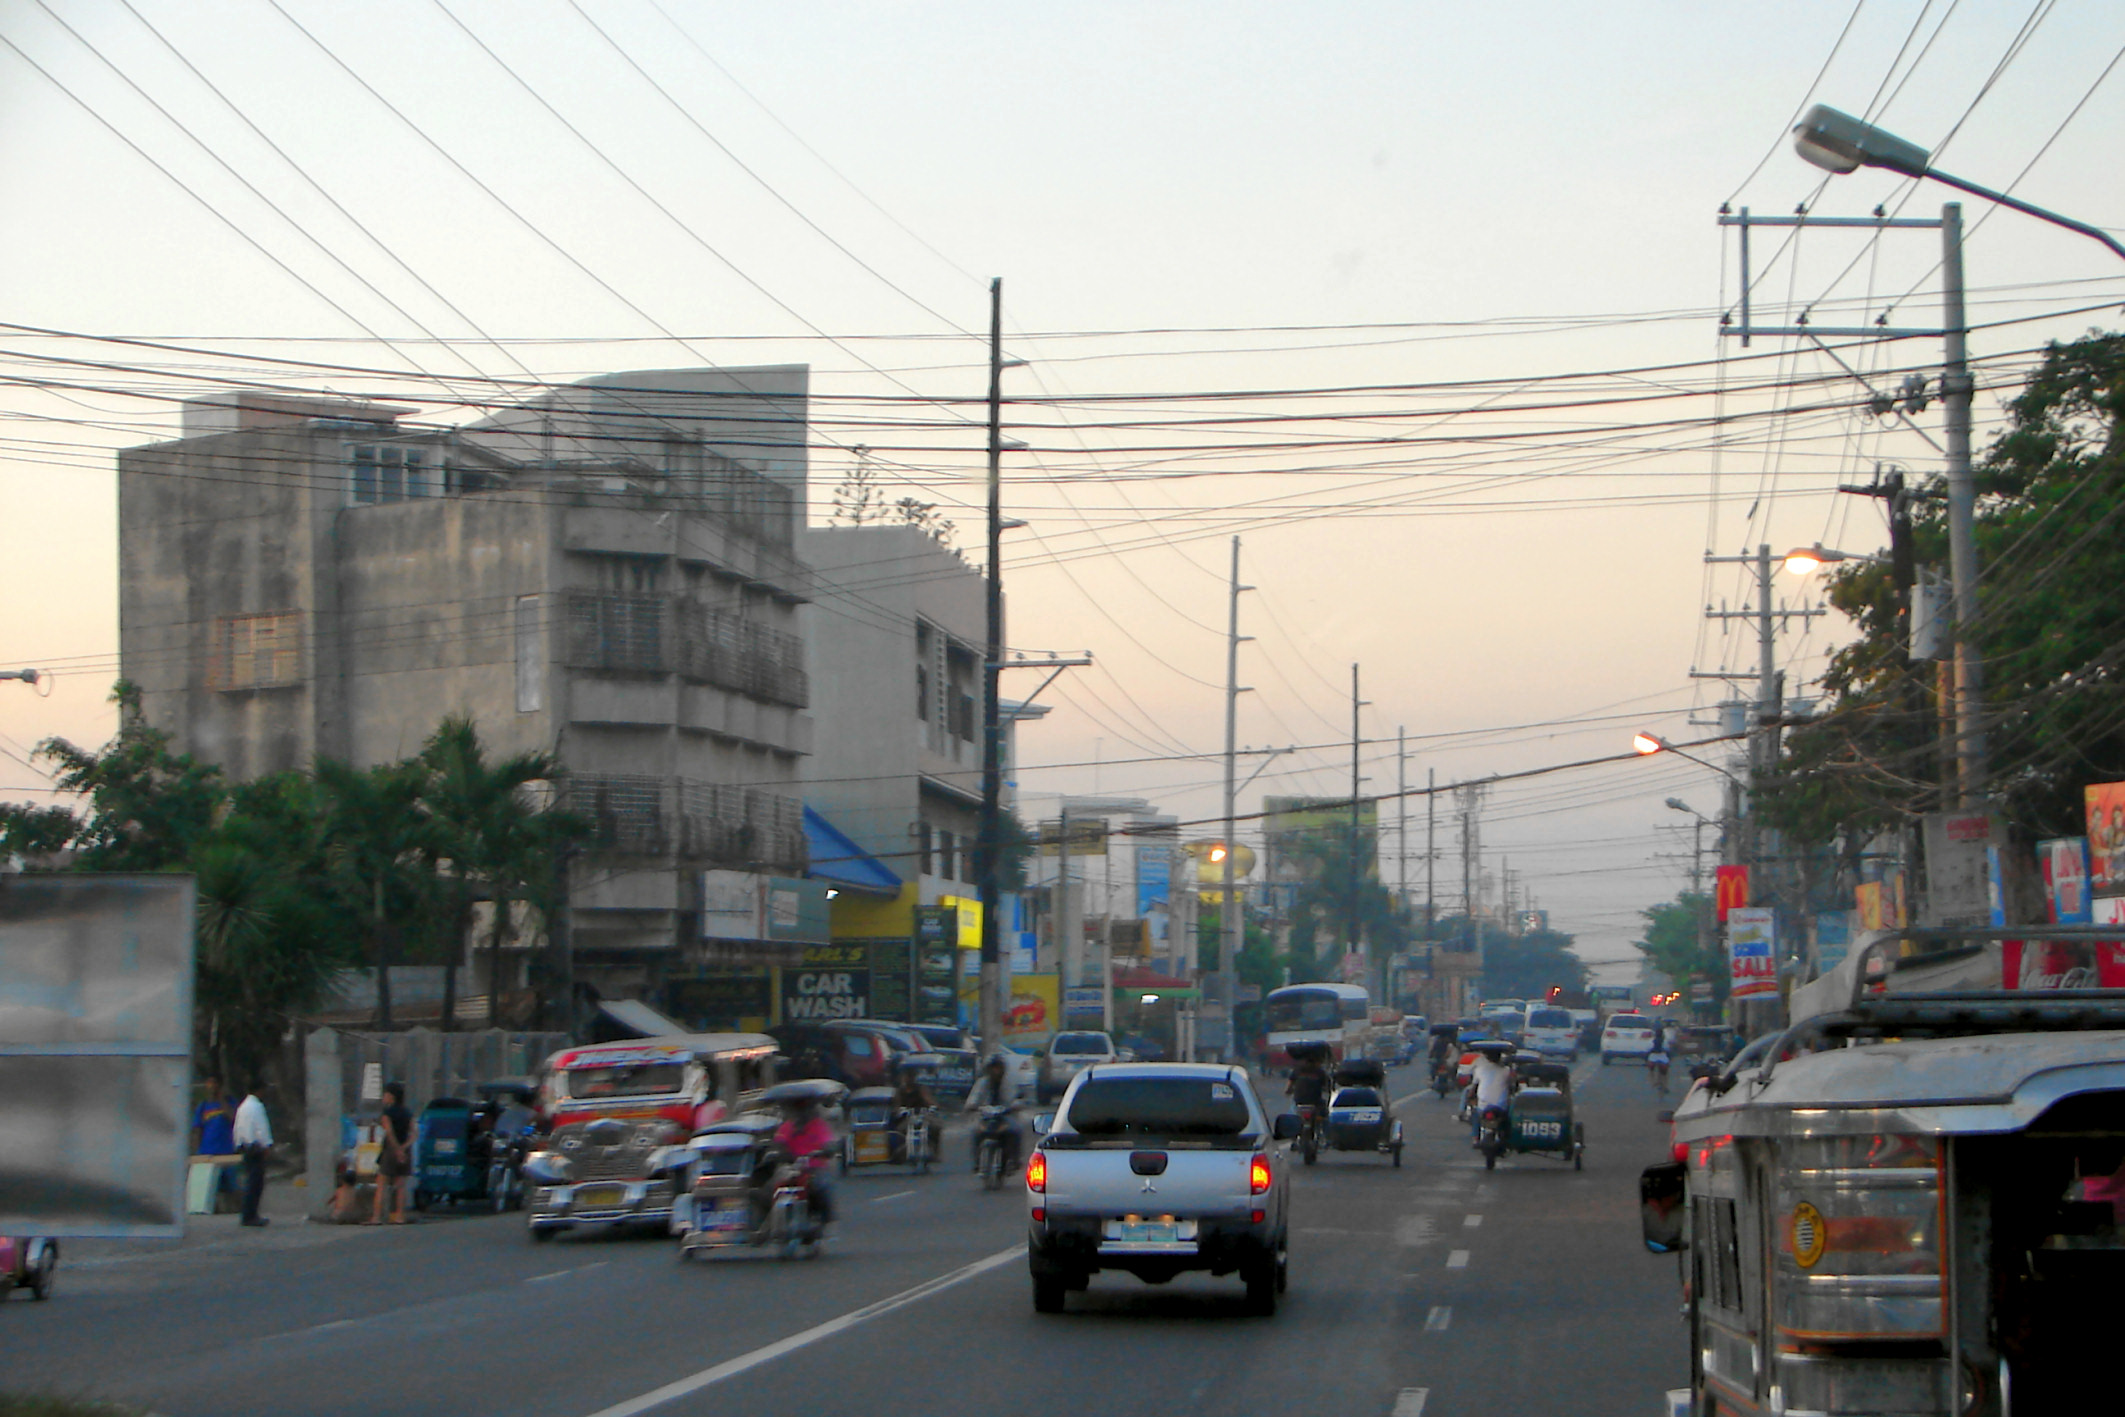
Capas
Capas is een gemeente in de Filipijnse provincie Tarlac op het eiland Luzon. Bij de laatste census in 2007 had de gemeente ruim 122 duizend inwoners.
Capas Wikipedia Page


Over onze gegevens
De gegevens op deze pagina zijn geschat met behulp van diverse openbaar beschikbare tools en bronnen. Ze worden aangeboden zonder garantie en kunnen onnauwkeurigheden bevatten. Gebruik op eigen risico.