Feiten over Fishhook
| Gebied | 72.9 mi² |
| Bevolking | 5.696 |
| Bbp per hoofd van de bevolking (koopkrachtpariteit) | $58.064 (2022) |
| Lokale tijd | |
| Tijdzone | Alaska-zomertijd |
| Breedte- & lengtegraad | 61.74402, -149.23613 |
Kaart van Fishhook
Interactieve kaart
Bevolking van Fishhook
Jaren 1975 tot 2030
| Data | 1975 | 1990 | 2000 | 2015 | 2020 | 2025* | 2030* |
|---|---|---|---|---|---|---|---|
| Bevolking | 0 | 0 | 0 | 0 | 5.696 | 6.362 | 7.095 |
| Bevolkingsdichtheid | 0 / mi² | 0 / mi² | 0 / mi² | 0 / mi² | 78,2 / mi² | 87,3 / mi² | 97,4 / mi² |
Bevolkingsdichtheid van Fishhook
Bevolkingsdichtheid: 78,2 / mi²
| Locatie | Bevolking | Gebied | Dichtheid |
|---|---|---|---|
| Fishhook | 5.696 | 72,88 sq mi | 78,2 / mi² |
| Alaska | 600.952 | 665.383,6 sq mi | 0,9 / mi² |
| Verenigde Staten | 321,6 million | 3.796.740,8 sq mi | 84,7 / mi² |
Historische en geprojecteerde bevolking van Fishhook
Geschatte bevolking van 1975 tot 2030
- JRC (European Commission's Joint Research Centre) werken aan de GHS built-up grid
- CIESIN (Center for International Earth Science Information Network)
- [Link] Klein Goldewijk, K., Beusen, A., Doelman, J., and Stehfest, E.: Anthropogenic land use estimates for the Holocene – HYDE 3.2, Earth Syst. Sci. Data, 9, 927–953, https://doi.org/10.5194/essd-9-927-2017, 2017.
Human Development Index (HDI)
Statistische samengestelde index van levensverwachting, opleiding en inkomen per hoofd van de bevolking.
Bruto binnenlands product (bbp) van Fishhook
Bbp per hoofd van de bevolking, koopkrachtpariteit (constante internationale dollars van 2017)
| Data | 1990 | 1995 | 2000 | 2005 | 2010 | 2015 | 2020 | 2022 |
|---|---|---|---|---|---|---|---|---|
| Bbp per hoofd van de bevolking | $81.422 | $68.481 | $81.374 | $75.411 | $85.403 | $75.802 | $59.646 | $58.064 |
| Totaal bbp | $13,3 mln. | $12,5 mln. | $16,7 mln. | $19,1 mln. | $26,5 mln. | $26,4 mln. | $21,5 mln. | $21,9 mln. |
CO2-uitstoot van Fishhook
Kooldioxide (CO2) -emissies per hoofd van de bevolking in ton per jaar
| Locatie | CO2 uitstoot | CO2-uitstoot per hoofd van de bevolking | CO2-emissie-intensiteit |
|---|---|---|---|
| Fishhook | 108,653 tn | 19.08 tn | 1,490.9 tons/mi² |
| Alaska | 9,533,511 tn | 15.86 tn | 14.3 tons/mi² |
| Verenigde Staten | 5,664,619,810 tn | 17.62 tn | 1,492 tons/mi² |
| CO2-uitstoot 2013 (ton/jaar) | 108,653 tn |
| CO2-uitstoot 2013 (ton/jaar) per hoofd van de bevolking | 19.08 tn |
| CO2-uitstootintensiteit 2013 (ton/mi²/jaar) | 1,490.9 tons/mi² |
Natuurlijk gevarenrisico
Relatief risico op 10
| Gevaar | Risiconiveau |
|---|---|
| Overstroming | Hoog (8) |
| Aardbeving | Hoog (8) |
| Aardverschuiving | Gemiddeld (7) |
* Risico, met name met betrekking tot overstromingen of aardverschuivingen, is mogelijk niet voor het hele gebied.
- Dilley, M., R.S. Chen, U. Deichmann, A.L. Lerner-Lam, M. Arnold, J. Agwe, P. Buys, O. Kjekstad, B. Lyon, and G. Yetman. 2005. Natural Disaster Hotspots: A Global Risk Analysis. Washington, D.C.: World Bank. https://doi.org/10.1596/0-8213-5930-4.
- Center for Hazards and Risk Research - CHRR - Columbia University, Center for International Earth Science Information Network - CIESIN - Columbia University, and Norwegian Geotechnical Institute - NGI. 2005. Global Landslide Hazard Distribution. Palisades, NY: NASA Socioeconomic Data and Applications Center (SEDAC). https://doi.org/10.7927/H4P848VZ.
- Center for Hazards and Risk Research - CHRR - Columbia University, Center for International Earth Science Information Network - CIESIN - Columbia University. 2005. Global Flood Hazard Frequency and Distribution. Palisades, NY: NASA Socioeconomic Data and Applications Center (SEDAC). https://doi.org/10.7927/H4668B3D.
- Center for Hazards and Risk Research - CHRR - Columbia University, Center for International Earth Science Information Network - CIESIN - Columbia University. 2005. Global Earthquake Hazard Distribution - Peak Ground Acceleration. Palisades, NY: NASA Socioeconomic Data and Applications Center (SEDAC). https://doi.org/10.7927/H4BZ63ZS.
Recente aardbevingen in de buurt
Magnitude 3.0 en hoger
| Datum▼ | Tijd↕ | Magnitude↕ | Distance↕ | Diepte↕ | Locatie↕ | Link |
|---|---|---|---|---|---|---|
| 8/14/19 | 9:18 AM | 3 | 29.3 km | 3,500 m | 24km NNW of Sutton-Alpine, Alaska | usgs.gov |
| 2/19/19 | 6:59 AM | 3.3 | 15.1 km | 6,900 m | 15km NNW of Fishhook, Alaska | usgs.gov |
| 10/12/18 | 5:16 PM | 3 | 36.6 km | 36,800 m | 12km SE of Knik-Fairview, Alaska | usgs.gov |
| 10/16/17 | 7:27 AM | 3 | 25.6 km | 28,500 m | 5km SSE of Meadow Lakes, Alaska | usgs.gov |
| 10/16/17 | 7:27 AM | 3 | 25.6 km | 28,500 m | Southern Alaska | usgs.gov |
| 7/30/17 | 2:47 AM | 3.2 | 29.9 km | 7,400 m | 29km N of Fishhook, Alaska | usgs.gov |
| 7/30/17 | 2:47 AM | 3.2 | 29.5 km | 6,200 m | Central Alaska | usgs.gov |
| 6/17/17 | 10:07 PM | 3 | 33.5 km | 40,200 m | 21km SE of Y, Alaska | usgs.gov |
| 3/24/17 | 9:39 PM | 3.2 | 19.4 km | 50,400 m | 19km WNW of Fishhook, Alaska | usgs.gov |
| 3/17/17 | 7:47 AM | 3.6 | 21.9 km | 3,300 m | 21km N of Fishhook, Alaska | usgs.gov |
Fishhook
Fishhook is een plaats (census-designated place) in de Amerikaanse staat Alaska, en valt bestuurlijk gezien onder Matanuska-Susitna Borough.
Fishhook Wikipedia Page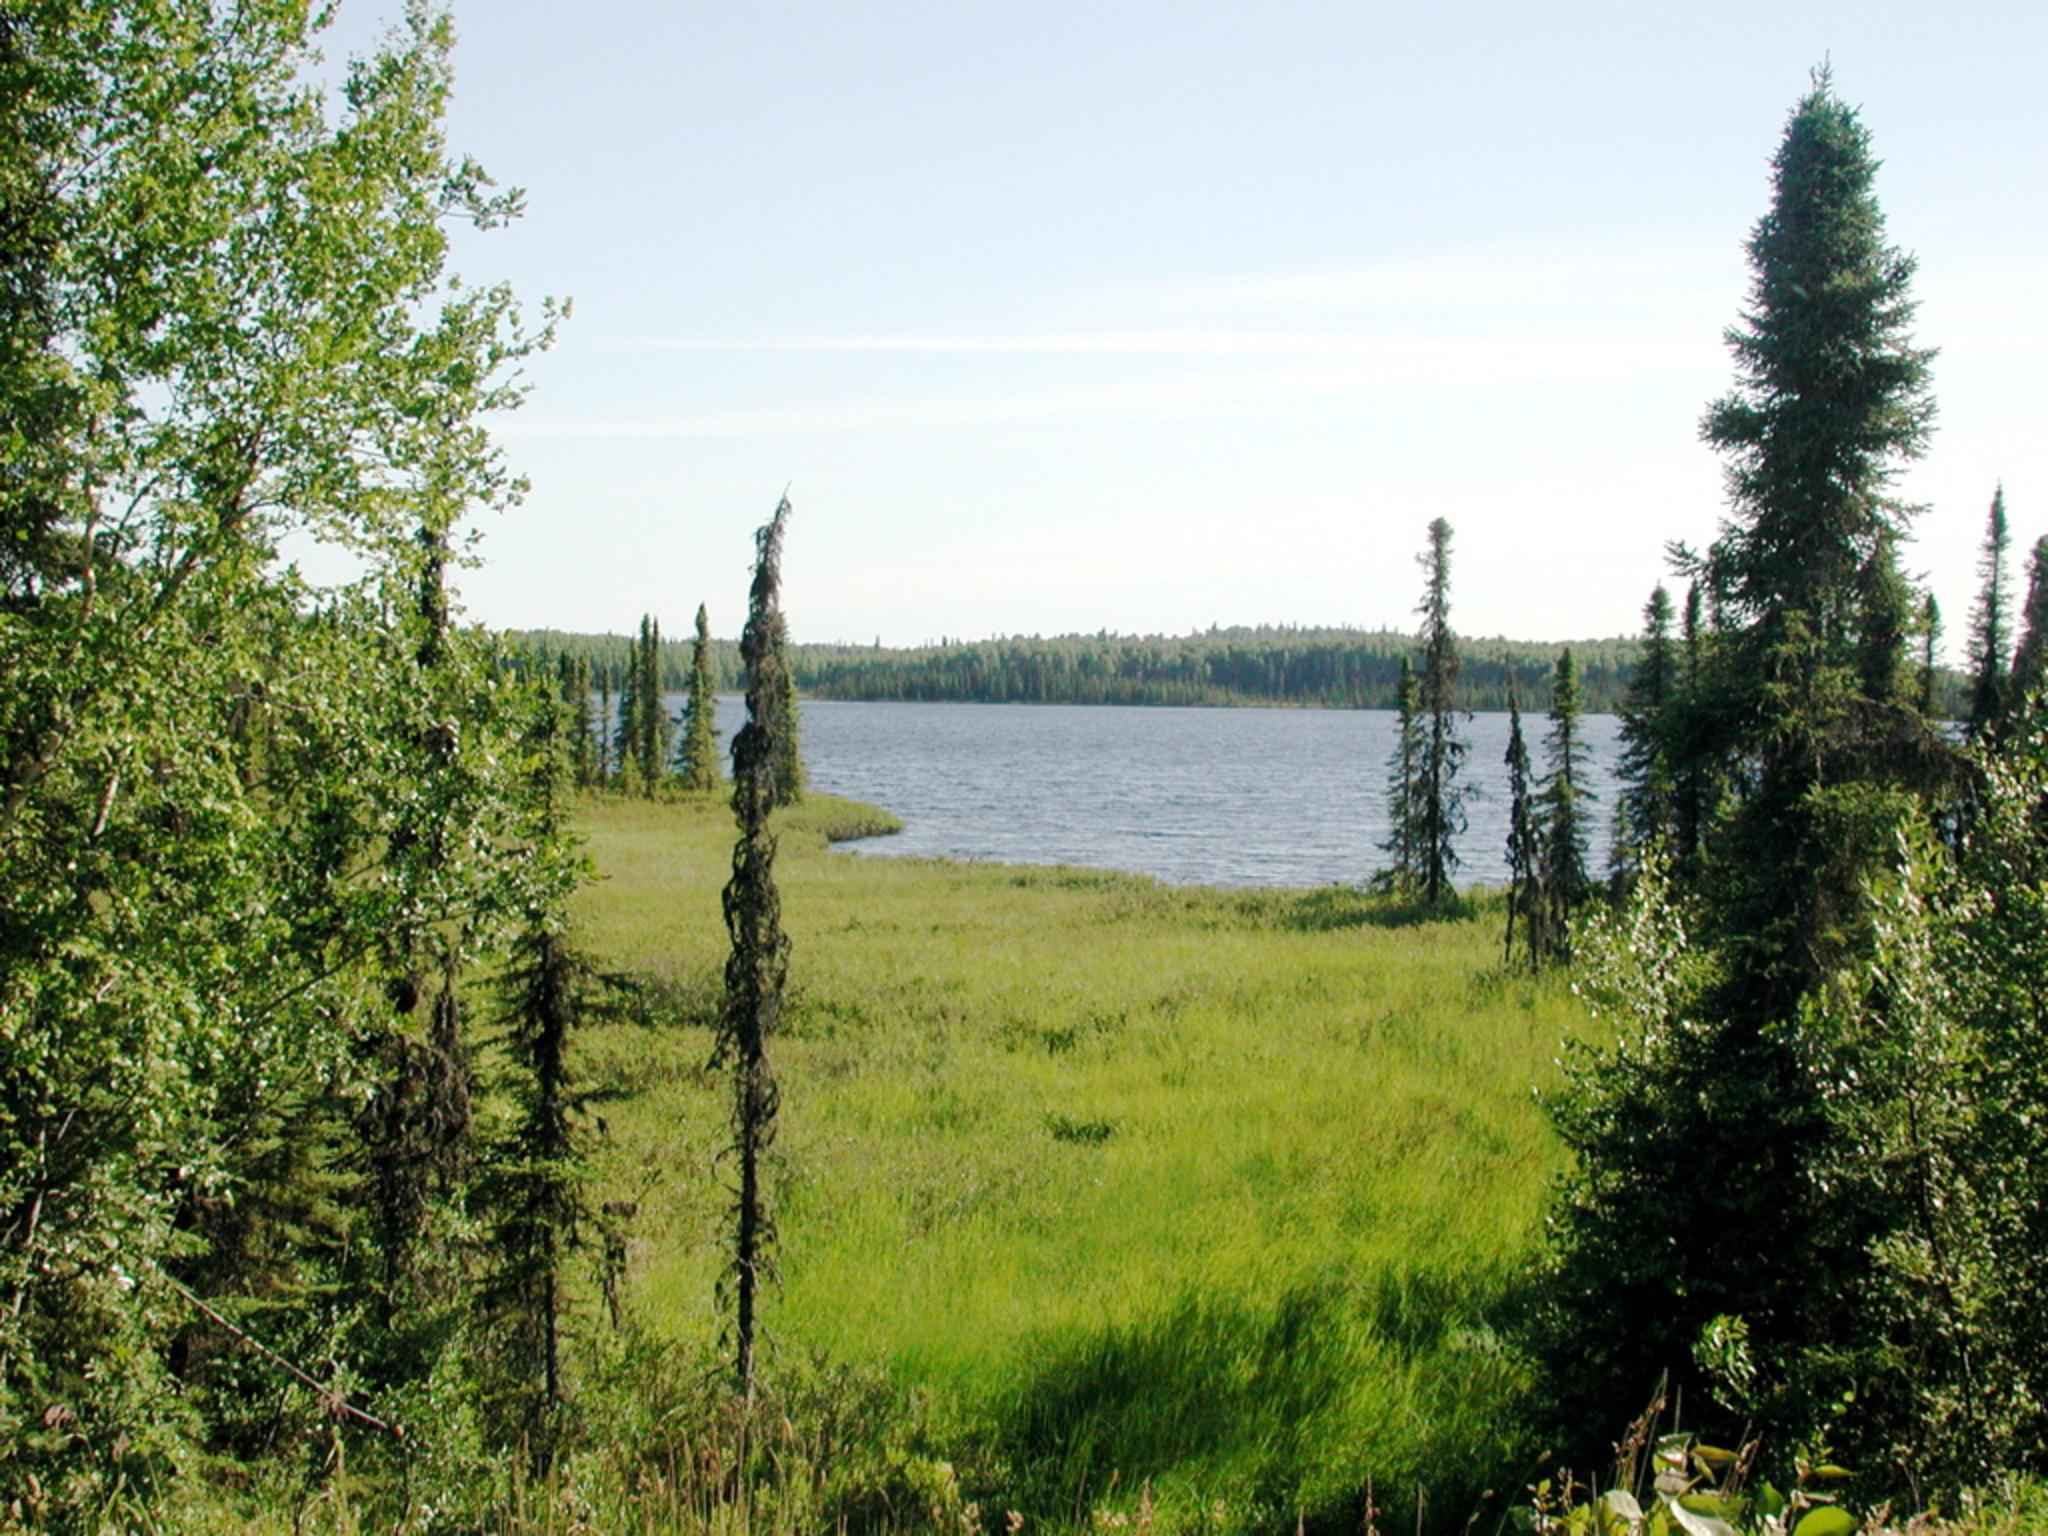


Over onze gegevens
De gegevens op deze pagina zijn geschat met behulp van diverse openbaar beschikbare tools en bronnen. Ze worden aangeboden zonder garantie en kunnen onnauwkeurigheden bevatten. Gebruik op eigen risico.