- Wereld
- »
- CA
- »
- Alberta
- »
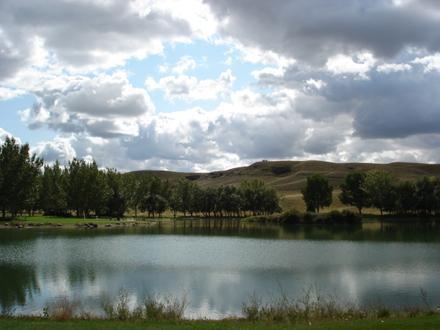
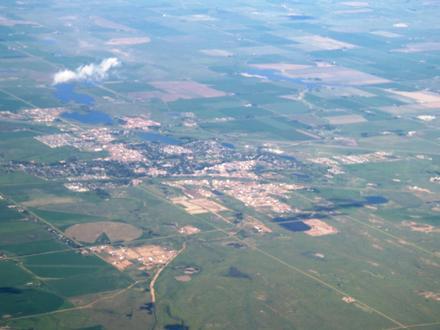
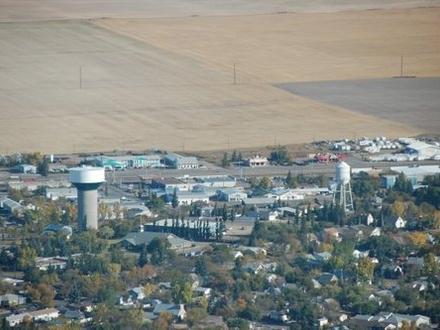
- Cereal, Alberta
Ondernemingen in Cereal
Industries
Bedrijfsdistributie per bedrijfstak Industrie: 24,7%
Hotels & Reizen: 16%
Religie (Geloof): 7,4%
Onderwijs: 7,4%
Automobiel: 6,2%
Restaurants: 6,2%
Financiële Diensten: 6,2%
Voedsel: 4,9%
Winkelen: 4,9%
Andere: 16%
| Gebied van Cereal, Alberta | 0,95 km² |
| Bevolking | 127 |
| Populatieverandering van 1975 tot 2015 | -31,4% |
| Populatieverandering van 2000 tot 2015 | -15,3% |
| Netnummers | 403 |
| Lokale tijd | donderdag 20:00 |
| Tijdzone | Mountain-zomertijd |
| Breedte- & lengtegraad | 51.41683° / -110.80169° |
| Postcodes | T0J |
Cereal, Alberta - Kaart
Cereal, Alberta Bevolking
Jaren 1975 tot 2015| Gegevens | 1975 | 1990 | 2000 | 2015 |
|---|---|---|---|---|
| Bevolking | 185 | 166 | 150 | 127 |
| Bevolkingsdichtheid | 194,7 / km² | 174,7 / km² | 157,9 / km² | 133,7 / km² |
Cereal Bevolkingswijziging van 2000 tot 2015
Afname van 15,3% van jaar 2000 tot 2015| Locatie | Wijziging sinds 1975 | Wijziging sinds 1990 | Wijziging sinds 2000 |
|---|---|---|---|
| Cereal, Alberta | -31,4% | -23,5% | -15,3% |
| Alberta | +127,1% | +63,7% | +34,1% |
| Canada | +55,8% | +30,2% | +17,2% |
Cereal, Alberta Bevolkingsdichtheid
Bevolkingsdichtheid: 133,7 / km²| Locatie | Bevolking | Gebied | Bevolkingsdichtheid |
|---|---|---|---|
| Cereal, Alberta | 127 | 0,95 km² | 133,7 / km² |
| Alberta | 4,1 miljoen | 663.102,6 km² | 6,11 / km² |
| Canada | 35,5 miljoen | 9.875.295,4 km² | 3,6 / km² |
Human Development Index (HDI)
Statistische samengestelde index van levensverwachting, opleiding en inkomen per hoofd van de bevolking.Sources: [Link] Kummu, M., Taka, M. & Guillaume, J. Gridded global datasets for Gross Domestic Product and Human Development Index over 1990–2015. Sci Data 5, 180004 (2018) doi:10.1038/sdata.2018.4
Cereal, Alberta CO2-uitstoot
Kooldioxide (CO2) -emissies per hoofd van de bevolking in ton per jaar| Locatie | CO2 uitstoot | CO2-uitstoot per hoofd van de bevolking | CO2-emissie-intensiteit |
|---|---|---|---|
| Cereal, Alberta | 1.905 ton | 15 ton | 2.005 ton/km² |
| Alberta | 65.353.612 ton | 16,1 ton | 98,6 ton/km² |
| Canada | 521.999.336 ton | 14,7 ton | 52,9 ton/km² |
Cereal, Alberta CO2-uitstoot
| 2013 CO2-uitstoot (ton/jaar) | 1.905 ton |
| 2013 CO2-uitstoot (ton/jaar) per hoofd | 15 ton |
| 2013 CO2-uitstoot intensiteit (ton/km²/jaar) | 2.005 ton/km² |
Natuurlijk gevarenrisico
Relatief risico op 10| Droogte | Hoog (9) |
* Risico, met name met betrekking tot overstromingen of aardverschuivingen, is mogelijk niet voor het hele gebied.
Sources: 1. Dilley, M., R.S. Chen, U. Deichmann, A.L. Lerner-Lam, M. Arnold, J. Agwe, P. Buys, O. Kjekstad, B. Lyon, and G. Yetman. 2005. Natural Disaster Hotspots: A Global Risk Analysis. Washington, D.C.: World Bank. https://doi.org/10.1596/0-8213-5930-4.
2. Center for Hazards and Risk Research - CHRR - Columbia University, Center for International Earth Science Information Network - CIESIN - Columbia University, and International Research Institute for Climate and Society - IRI - Columbia University. 2005. Global Drought Hazard Frequency and Distribution. Palisades, NY: NASA Socioeconomic Data and Applications Center (SEDAC). https://doi.org/10.7927/H4VX0DFT.
Cereal, Alberta
Cereal is een plaats (village) in de Canadese provincie Alberta en telt 126 inwoners (2006). Cereal Wikipedia Page

Over onze gegevens
De gegevens op deze pagina worden geschat met behulp van een aantal openbaar beschikbare hulpmiddelen en bronnen. Het wordt zonder garantie verstrekt en kan onnauwkeurigheden bevatten. Gebruik op eigen risico. Kijk hier voor meer informatie.