Ondernemingen in Bad Oldesloe
Hotels & Reizen
Restaurants
Automobiel
Financiële Diensten
Medisch
Beauty & Spas
Maatschappij & Overheid
Industries
Bedrijfsdistributie per bedrijfstak Winkelen: 18,4%
Professionele Diensten: 13,5%
Medisch: 10,6%
Industrie: 9,2%
Thuisdiensten: 6,7%
Restaurants: 5%
Andere: 36,5%
| Industrie omschrijving | Aantal bedrijven | Gemiddelde Google-beoordeling | Bedrijven per 1.000 inwoners |
|---|---|---|---|
| Autogarage | 33 | 4.4 | 1,8 |
| Kappers | 27 | 4.3 | 1,5 |
| Schoonheidsalons | 35 | 4.3 | 1,9 |
| Banken | 20 | 3.6 | 1,1 |
| Lening Bedrijven | 50 | 3.9 | 2,8 |
| Bakkerijen | 18 | 4.4 | 1,0 |
| Buurtwinkels en supermarkten | 45 | 4.2 | 2,5 |
| Algemene Aannemers | 34 | 4.0 | 1,9 |
| Elektrische installatie | 25 | 4.5 | 1,4 |
| Onroerend Goed | 47 | 3.4 | 2,6 |
| Andere ledenorganisaties | 20 | 4.4 | 1,1 |
| Medisch en gezondheid | 195 | 3.9 | 10,8 |
| Tandartsen | 28 | 4.7 | 1,6 |
| Ziekenhuizen | 20 | 2.9 | 1,1 |
| Accountants | 22 | 4.2 | 1,2 |
| Advocaten/juristen | 19 | 4.9 | 1,1 |
| Architecten | 27 | 5.0 | 1,5 |
| Corporate management | 22 | 4.3 | 1,2 |
| Juridisch en financieel | 22 | 4.2 | 1,2 |
| Technische bouwbedrijven | 21 | 4.4 | 1,2 |
| Apotheken | 31 | 3.9 | 1,7 |
| Bouwmarkten | 24 | 4.0 | 1,3 |
| Electronicawinkel | 33 | 3.6 | 1,8 |
| Kledingwinkels | 22 | 3.8 | 1,2 |
| Gebied van Bad Oldesloe, Sleeswijk-Holstein | 8,1 km² |
| Bevolking | 18.015 |
| Mannelijke bevolking | 8.674 (48,1%) |
| Vrouwelijke bevolking | 9.341 (51,9%) |
| Populatieverandering van 1975 tot 2015 | +25,7% |
| Populatieverandering van 2000 tot 2015 | +4,6% |
| Gemiddelde leeftijd | 45,8 |
| Gemiddelde leeftijd bij de mannen | 45,2 |
| Gemiddelde leeftijd bij de vrouwen | 46,4 |
| Netnummers | 4531 |
| Buurten | Blumendorf, Glinde, Poggensee, Rethwischfeld, Schadehorn, Seefeld, Sehmsdorf, Wolkenwehe |
| Lokale tijd | vrijdag 17:43 |
| Tijdzone | Midden-Europese zomertijd |
| Breedte- & lengtegraad | 53.81167° / 10.37417° |
Bad Oldesloe, Sleeswijk-Holstein - Kaart
Bad Oldesloe, Sleeswijk-Holstein Bevolking
Jaren 1975 tot 2015| Gegevens | 1975 | 1990 | 2000 | 2015 |
|---|---|---|---|---|
| Bevolking | 14.337 | 15.550 | 17.215 | 18.015 |
| Bevolkingsdichtheid | 1.770 / km² | 1.919 / km² | 2.125 / km² | 2.224 / km² |
Bad Oldesloe Bevolkingswijziging van 2000 tot 2015
Toename van 4,6% van jaar 2000 tot 2015| Locatie | Wijziging sinds 1975 | Wijziging sinds 1990 | Wijziging sinds 2000 |
|---|---|---|---|
| Bad Oldesloe, Sleeswijk-Holstein | +25,7% | +15,9% | +4,6% |
| Sleeswijk-Holstein | +14,9% | +9,1% | +2,3% |
| Duitsland | +2,6% | +2,2% | -1,5% |
Bad Oldesloe, Sleeswijk-Holstein Mediaan leeftijd
Gemiddelde leeftijd: 45,8 jaar| Locatie | Gemiddelde leeftijd | Mediane leeftijd (vrouw) | Mediane leeftijd (mannelijk) |
|---|---|---|---|
| Bad Oldesloe, Sleeswijk-Holstein | 45,8 jaar | 46,4 jaar | 45,2 jaar |
| Sleeswijk-Holstein | 45,3 jaar | 46,3 jaar | 44,3 jaar |
| Duitsland | 44,8 jaar | 46 jaar | 43,6 jaar |
Bad Oldesloe, Sleeswijk-Holstein Bevolkingspiramide
Bevolking per leeftijd en geslacht| Leeftijd | Mannelijk | Vrouwelijk | Totaal |
|---|---|---|---|
| Onder 5 | 390 | 381 | 772 |
| 5-9 | 437 | 419 | 856 |
| 10-14 | 507 | 492 | 1.000 |
| 15-19 | 464 | 462 | 927 |
| 20-24 | 410 | 396 | 807 |
| 25-29 | 371 | 408 | 780 |
| 30-34 | 441 | 495 | 936 |
| 35-39 | 502 | 540 | 1.042 |
| 40-44 | 786 | 828 | 1.615 |
| 45-49 | 841 | 869 | 1.710 |
| 50-54 | 685 | 687 | 1.373 |
| 55-59 | 581 | 591 | 1.173 |
| 60-64 | 545 | 564 | 1.110 |
| 65-69 | 515 | 558 | 1.074 |
| 70-74 | 565 | 616 | 1.182 |
| 75-79 | 330 | 411 | 742 |
| 80-84 | 189 | 297 | 486 |
| 85 Plus | 114 | 327 | 441 |
Bad Oldesloe, Sleeswijk-Holstein Bevolkingsdichtheid
Bevolkingsdichtheid: 2.224 / km²| Locatie | Bevolking | Gebied | Bevolkingsdichtheid |
|---|---|---|---|
| Bad Oldesloe, Sleeswijk-Holstein | 18.015 | 8,1 km² | 2.224 / km² |
| Sleeswijk-Holstein | 2,8 miljoen | 15.915,1 km² | 177,4 / km² |
| Duitsland | 80,7 miljoen | 358.179,8 km² | 225,2 / km² |
Bad Oldesloe, Sleeswijk-Holstein Historische bevolking
Geschatte oudere bevolking tot 2015Sources:
1. JRC (European Commission's Joint Research Centre) work on the GHS built-up grid
2. CIESIN (Center for International Earth Science Information Network)
3. [Link] Klein Goldewijk, K., Beusen, A., Doelman, J., and Stehfest, E.: Anthropogenic land use estimates for the Holocene – HYDE 3.2, Earth Syst. Sci. Data, 9, 927–953, https://doi.org/10.5194/essd-9-927-2017, 2017.
Buurten
Bedrijfsdistributie per buurt in Bad Oldesloe Rethwischfeld: 46%
Wolkenwehe: 13,2%
Blumendorf: 8,5%
Seefeld: 6,9%
Glinde: 4,8%
Schadehorn: 4,8%
Andere: 15,9%
Bedrijfsspreiding voor Bad Oldesloe, Sleeswijk-Holstein
Goedkoop: 64,8%
Matig: 33,3%
Erg Duur: 1,9%
Human Development Index (HDI)
Statistische samengestelde index van levensverwachting, opleiding en inkomen per hoofd van de bevolking.Sources: [Link] Kummu, M., Taka, M. & Guillaume, J. Gridded global datasets for Gross Domestic Product and Human Development Index over 1990–2015. Sci Data 5, 180004 (2018) doi:10.1038/sdata.2018.4
Bad Oldesloe, Sleeswijk-Holstein CO2-uitstoot
Kooldioxide (CO2) -emissies per hoofd van de bevolking in ton per jaar| Locatie | CO2 uitstoot | CO2-uitstoot per hoofd van de bevolking | CO2-emissie-intensiteit |
|---|---|---|---|
| Bad Oldesloe, Sleeswijk-Holstein | 191.836 ton | 10,6 ton | 23.683 ton/km² |
| Sleeswijk-Holstein | 27.326.926 ton | 9,68 ton | 1.717 ton/km² |
| Duitsland | 755.339.039 ton | 9,36 ton | 2.108 ton/km² |
Bad Oldesloe, Sleeswijk-Holstein CO2-uitstoot
| 2013 CO2-uitstoot (ton/jaar) | 191.836 ton |
| 2013 CO2-uitstoot (ton/jaar) per hoofd | 10,6 ton |
| 2013 CO2-uitstoot intensiteit (ton/km²/jaar) | 23.683 ton/km² |
Recente aardbevingen in de buurt
Magnitude 3.0 en hoger
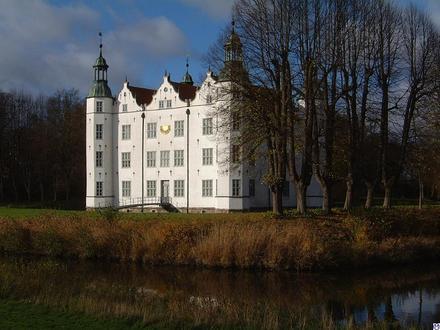
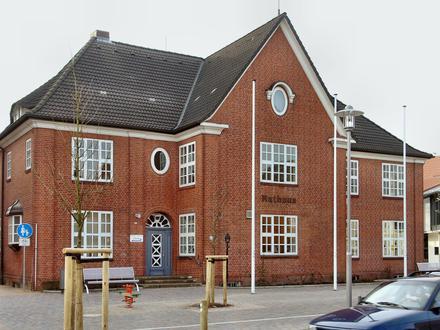
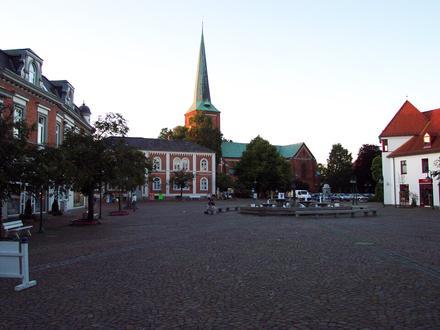
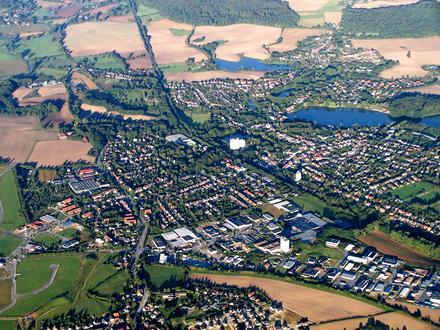
Bad Oldesloe, Sleeswijk-Holstein
Bad Oldesloe [ˌbatˀɔldəsˈloː]? is een gemeente in de Duitse deelstaat Sleeswijk-Holstein. Het is de Kreisstadt van het Kreis Stormarn. De stad telt 24.699 inwoners. Oldesloe ligt aan de Bundesautobahn 21 en de spoorlijn Lübeck - Hamburg. In de plaats staat si.. Bad Oldesloe Wikipedia Page
Over onze gegevens
De gegevens op deze pagina worden geschat met behulp van een aantal openbaar beschikbare hulpmiddelen en bronnen. Het wordt zonder garantie verstrekt en kan onnauwkeurigheden bevatten. Gebruik op eigen risico. Kijk hier voor meer informatie.