- Wereld
- »
- DE
- »
- Rijnland-Palts
- »
- Roes (Eifel)
Ondernemingen in Roes (Eifel)
Industries
Bedrijfsdistributie per bedrijfstak Hotels & Reizen: 16,3%
Professionele Diensten: 12%
Industrie: 8,7%
Winkelen: 8,7%
Thuisdiensten: 8,7%
Restaurants: 7,6%
Voedsel: 5,4%
Religie (Geloof): 5,4%
Lokale Diensten: 5,4%
Andere: 21,7%
| Gebied van Roes (Eifel) | 0,3 km² |
| Bevolking | 437 |
| Populatieverandering van 1975 tot 2015 | -1,4% |
| Populatieverandering van 2000 tot 2015 | -2,9% |
| Netnummers | 2672 |
| Lokale tijd | zaterdag 18:37 |
| Tijdzone | Midden-Europese zomertijd |
| Breedte- & lengtegraad | 50.24281° / 7.25836° |
Roes (Eifel) - Kaart
Roes (Eifel) Bevolking
Jaren 1975 tot 2015| Gegevens | 1975 | 1990 | 2000 | 2015 |
|---|---|---|---|---|
| Bevolking | 443 | 440 | 450 | 437 |
| Bevolkingsdichtheid | 1.476 / km² | 1.466 / km² | 1.500 / km² | 1.456 / km² |
Roes (Eifel) Bevolkingswijziging van 2000 tot 2015
Afname van 2,9% van jaar 2000 tot 2015| Locatie | Wijziging sinds 1975 | Wijziging sinds 1990 | Wijziging sinds 2000 |
|---|---|---|---|
| Roes (Eifel) | -1,4% | -0,7% | -2,9% |
| Rijnland-Palts | +13% | +8,5% | +2,2% |
| Duitsland | +2,6% | +2,2% | -1,5% |
Roes (Eifel) Bevolkingsdichtheid
Bevolkingsdichtheid: 1.456 / km²| Locatie | Bevolking | Gebied | Bevolkingsdichtheid |
|---|---|---|---|
| Roes (Eifel) | 437 | 0,3 km² | 1.456 / km² |
| Rijnland-Palts | 4,0 miljoen | 19.855,3 km² | 203,2 / km² |
| Duitsland | 80,7 miljoen | 358.179,8 km² | 225,2 / km² |
Roes (Eifel) Historische en Geschatte Bevolking
Geschatte oudere bevolking tot 2100Sources:
1. JRC (European Commission's Joint Research Centre) work on the GHS built-up grid
2. CIESIN (Center for International Earth Science Information Network)
3. [Link] Klein Goldewijk, K., Beusen, A., Doelman, J., and Stehfest, E.: Anthropogenic land use estimates for the Holocene – HYDE 3.2, Earth Syst. Sci. Data, 9, 927–953, https://doi.org/10.5194/essd-9-927-2017, 2017.
Postcode
Percentage gebiedscodes gebruikt door bedrijven in Roes (Eifel) Netnummer 2672: 89,5%
Netnummer 162: 5,3%
Netnummer 2451: 5,3%
Human Development Index (HDI)
Statistische samengestelde index van levensverwachting, opleiding en inkomen per hoofd van de bevolking.Sources: [Link] Kummu, M., Taka, M. & Guillaume, J. Gridded global datasets for Gross Domestic Product and Human Development Index over 1990–2015. Sci Data 5, 180004 (2018) doi:10.1038/sdata.2018.4
Roes (Eifel) CO2-uitstoot
Kooldioxide (CO2) -emissies per hoofd van de bevolking in ton per jaar| Locatie | CO2 uitstoot | CO2-uitstoot per hoofd van de bevolking | CO2-emissie-intensiteit |
|---|---|---|---|
| Roes (Eifel) | 1.951 ton | 4,47 ton | 6.504 ton/km² |
| Rijnland-Palts | 18.526.864 ton | 4,59 ton | 933,1 ton/km² |
| Duitsland | 755.339.039 ton | 9,36 ton | 2.108 ton/km² |
Roes (Eifel) CO2-uitstoot
| 2013 CO2-uitstoot (ton/jaar) | 1.951 ton |
| 2013 CO2-uitstoot (ton/jaar) per hoofd | 4,47 ton |
| 2013 CO2-uitstoot intensiteit (ton/km²/jaar) | 6.504 ton/km² |
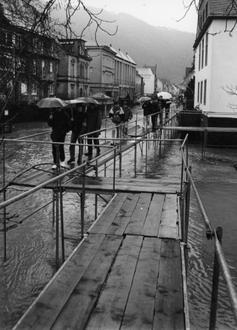
Natuurlijk gevarenrisico
Relatief risico op 10| Overstroming | Hoog (9) |
| Aardbeving | Gemiddels (4) |
* Risico, met name met betrekking tot overstromingen of aardverschuivingen, is mogelijk niet voor het hele gebied.
Sources: 1. Dilley, M., R.S. Chen, U. Deichmann, A.L. Lerner-Lam, M. Arnold, J. Agwe, P. Buys, O. Kjekstad, B. Lyon, and G. Yetman. 2005. Natural Disaster Hotspots: A Global Risk Analysis. Washington, D.C.: World Bank. https://doi.org/10.1596/0-8213-5930-4.
2. Center for Hazards and Risk Research - CHRR - Columbia University, Center for International Earth Science Information Network - CIESIN - Columbia University. 2005. Global Flood Hazard Frequency and Distribution. Palisades, NY: NASA Socioeconomic Data and Applications Center (SEDAC). https://doi.org/10.7927/H4668B3D.
3. Center for Hazards and Risk Research - CHRR - Columbia University, Center for International Earth Science Information Network - CIESIN - Columbia University. 2005. Global Earthquake Hazard Distribution - Peak Ground Acceleration. Palisades, NY: NASA Socioeconomic Data and Applications Center (SEDAC). https://doi.org/10.7927/H4BZ63ZS.
Recente aardbevingen in de buurt
Magnitude 3.0 en hoger| Datum | Tijd | Omvang | Afstand | Diepte | Locatie | Link |
|---|---|---|---|---|---|---|
| 14-02-2011 | 04:43 | 3,9 | 42,9 km | 12.000 m | Germany | usgs.gov |
| 11-04-2010 | 04:16 | 3,4 | 13,6 km | 5.000 m | Germany | usgs.gov |
| 02-08-2007 | 19:58 | 4,4 | 18 km | 10.000 m | Germany | usgs.gov |
| 11-04-2007 | 10:01 | 3,3 | 9,4 km | 11.500 m | Germany | usgs.gov |
| 18-11-2006 | 00:26 | 3,1 | 8,9 km | 10.000 m | Germany | usgs.gov |
| 22-09-2006 | 04:48 | 3,3 | 17,5 km | 10.000 m | Germany | usgs.gov |
| 14-07-2006 | 05:30 | 3,2 | 79,5 km | 7.000 m | Germany | usgs.gov |
| 07-03-2006 | 13:26 | 3,1 | 23,8 km | 5.000 m | Germany | usgs.gov |
| 09-11-2005 | 21:43 | 3,5 | 40,7 km | 10.000 m | Germany | usgs.gov |
| 21-05-2004 | 22:19 | 4,2 | 21 km | 10.000 m | Germany | usgs.gov |
Zoek het optreden van aardbevingen nabij Roes (Eifel)
Vroegste datum Uiterste datum
Magnitude 3.0 en hoger Magnitude 4.0 en hoger Magnitude 5.0 en hoger
")
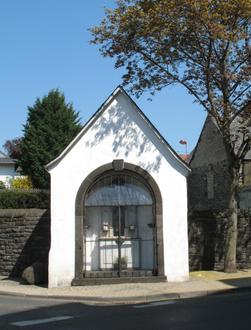
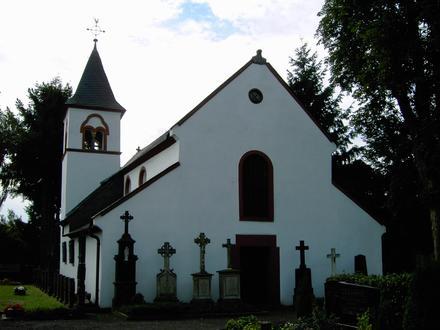
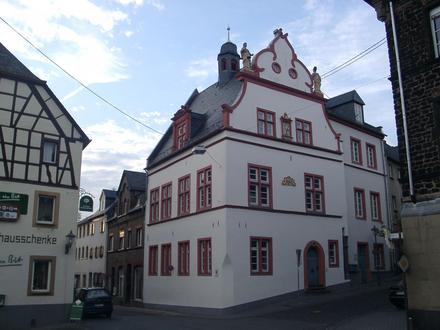
Roes (Eifel)
Roes (Spreek uit als reus en in het dialect Ries) is een plaats in de Duitse deelstaat Rijnland-Palts, en maakt deel uit van de Landkreis Cochem-Zell. Roes telt 504 inwoners. Ieder jaar met pinksteren heeft er een jungesellenfest plaats (met onder andere Belgi.. Roes (Eifel) Wikipedia Page
Over onze gegevens
De gegevens op deze pagina worden geschat met behulp van een aantal openbaar beschikbare hulpmiddelen en bronnen. Het wordt zonder garantie verstrekt en kan onnauwkeurigheden bevatten. Gebruik op eigen risico. Kijk hier voor meer informatie.