Ondernemingen in Callantsoog
Hotels & Reizen
Restaurants
Automobiel
Financiële Diensten
Medisch
Beauty & Spas
Maatschappij & Overheid
Industries
Bedrijfsdistributie per bedrijfstak Hotels & Reizen: 22,9%
Winkelen: 12,4%
Professionele Diensten: 10,2%
Thuisdiensten: 8,8%
Restaurants: 8,2%
Industrie: 7,7%
Sport & Activiteiten: 5,9%
Andere: 23,9%
| Industrie omschrijving | Aantal bedrijven | Gemiddelde Google-beoordeling | Bedrijven per 1.000 inwoners |
|---|---|---|---|
| Schoonheidsalons | 6 | 4.8 | 2,3 |
| Buurtwinkels en supermarkten | 8 | 4.4 | 3,1 |
| Algemene Aannemers | 9 | 4.2 | 3,4 |
| Bouw anders | 12 | 5.0 | 4,6 |
| Onroerend Goed | 6 | 4.1 | 2,3 |
| Campings | 32 | 4.3 | 12,3 |
| Hotels en motels | 10 | 4.0 | 3,8 |
| Overige accommodatie | 43 | 4.2 | 16,5 |
| Vakantiehuisjes, chalets en resorts | 19 | 4.4 | 7,3 |
| Medisch en gezondheid | 13 | 4.8 | 5,0 |
| Bars en café's | 5 | 3.8 | 1,9 |
| Café's | 10 | 4.1 | 3,8 |
| Dameskleding | 5 | 4.1 | 1,9 |
| Kledingwinkels | 5 | 4.3 | 1,9 |
| Stadsparken | 6 | 4.3 | 2,3 |
| Gebied van Callantsoog, Noord-Holland | 26,1 km² |
| Bevolking | 2.611 |
| Mannelijke bevolking | 1.314 (50,3%) |
| Vrouwelijke bevolking | 1.297 (49,7%) |
| Populatieverandering van 1975 tot 2015 | +41,1% |
| Populatieverandering van 2000 tot 2015 | +17,3% |
| Gemiddelde leeftijd | 44,1 |
| Gemiddelde leeftijd bij de mannen | 43,8 |
| Gemiddelde leeftijd bij de vrouwen | 44,5 |
| Netnummers | 224 |
| Lokale tijd | vrijdag 08:56 |
| Tijdzone | Midden-Europese zomertijd |
| Breedte- & lengtegraad | 52.84° / 4.69583° |
| Postcodes | 1751, 1759 |
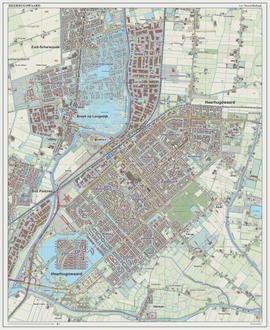
Callantsoog, Noord-Holland - Kaart
Callantsoog, Noord-Holland Bevolking
Jaren 1975 tot 2015| Gegevens | 1975 | 1990 | 2000 | 2015 |
|---|---|---|---|---|
| Bevolking | 1.851 | 2.023 | 2.226 | 2.611 |
| Bevolkingsdichtheid | 71,0 / km² | 77,6 / km² | 85,4 / km² | 100,1 / km² |
Callantsoog Bevolkingswijziging van 2000 tot 2015
Toename van 17,3% van jaar 2000 tot 2015| Locatie | Wijziging sinds 1975 | Wijziging sinds 1990 | Wijziging sinds 2000 |
|---|---|---|---|
| Callantsoog, Noord-Holland | +41,1% | +29,1% | +17,3% |
| Noord-Holland | +32,8% | +18,1% | +9% |
| Nederland | +24,3% | +13,4% | +6,5% |
Callantsoog, Noord-Holland Mediaan leeftijd
Gemiddelde leeftijd: 44,1 jaar| Locatie | Gemiddelde leeftijd | Mediane leeftijd (vrouw) | Mediane leeftijd (mannelijk) |
|---|---|---|---|
| Callantsoog, Noord-Holland | 44,1 jaar | 44,5 jaar | 43,8 jaar |
| Noord-Holland | 40,4 jaar | 40,9 jaar | 39,9 jaar |
| Nederland | 41 jaar | 41,7 jaar | 40,2 jaar |
Callantsoog, Noord-Holland Bevolkingspiramide
Bevolking per leeftijd en geslacht| Leeftijd | Mannelijk | Vrouwelijk | Totaal |
|---|---|---|---|
| Onder 5 | 64 | 64 | 129 |
| 5-9 | 80 | 73 | 154 |
| 10-14 | 82 | 84 | 167 |
| 15-19 | 82 | 77 | 160 |
| 20-24 | 66 | 59 | 126 |
| 25-29 | 62 | 58 | 120 |
| 30-34 | 63 | 58 | 121 |
| 35-39 | 81 | 84 | 165 |
| 40-44 | 103 | 101 | 204 |
| 45-49 | 105 | 96 | 201 |
| 50-54 | 100 | 103 | 203 |
| 55-59 | 101 | 103 | 205 |
| 60-64 | 115 | 111 | 226 |
| 65-69 | 87 | 72 | 159 |
| 70-74 | 58 | 54 | 113 |
| 75-79 | 33 | 41 | 74 |
| 80-84 | 21 | 29 | 51 |
| 85 Plus | 12 | 30 | 42 |
Callantsoog, Noord-Holland Bevolkingsdichtheid
Bevolkingsdichtheid: 100,1 / km²| Locatie | Bevolking | Gebied | Bevolkingsdichtheid |
|---|---|---|---|
| Callantsoog, Noord-Holland | 2.611 | 26,1 km² | 100,1 / km² |
| Noord-Holland | 2,8 miljoen | 4.094,3 km² | 671,9 / km² |
| Nederland | 16,9 miljoen | 41.398,3 km² | 408,7 / km² |
Callantsoog, Noord-Holland geschatte bevolking
Geschatte bevolking van 1975 tot 2100Sources:
1. JRC (European Commission's Joint Research Centre) work on the GHS built-up grid
2. CIESIN (Center for International Earth Science Information Network)
3. [Link] Klein Goldewijk, K., Beusen, A., Doelman, J., and Stehfest, E.: Anthropogenic land use estimates for the Holocene – HYDE 3.2, Earth Syst. Sci. Data, 9, 927–953, https://doi.org/10.5194/essd-9-927-2017, 2017.
Postcode
Percentage gebiedscodes gebruikt door bedrijven in Callantsoog Netnummer 224: 66,9%
Netnummer 6: 22,6%
Netnummer 223: 5,9%
Andere: 4,5%
Human Development Index (HDI)
Statistische samengestelde index van levensverwachting, opleiding en inkomen per hoofd van de bevolking.Sources: [Link] Kummu, M., Taka, M. & Guillaume, J. Gridded global datasets for Gross Domestic Product and Human Development Index over 1990–2015. Sci Data 5, 180004 (2018) doi:10.1038/sdata.2018.4
Callantsoog, Noord-Holland CO2-uitstoot
Kooldioxide (CO2) -emissies per hoofd van de bevolking in ton per jaar| Locatie | CO2 uitstoot | CO2-uitstoot per hoofd van de bevolking | CO2-emissie-intensiteit |
|---|---|---|---|
| Callantsoog, Noord-Holland | 29.221 ton | 11,2 ton | 1.120 ton/km² |
| Noord-Holland | 23.619.213 ton | 8,59 ton | 5.768 ton/km² |
| Nederland | 167.743.567 ton | 9,91 ton | 4.051 ton/km² |
Callantsoog, Noord-Holland CO2-uitstoot
| 2013 CO2-uitstoot (ton/jaar) | 29.221 ton |
| 2013 CO2-uitstoot (ton/jaar) per hoofd | 11,2 ton |
| 2013 CO2-uitstoot intensiteit (ton/km²/jaar) | 1.120 ton/km² |
Recente aardbevingen in de buurt
Magnitude 3.0 en hoger| Datum | Tijd | Omvang | Afstand | Diepte | Locatie | Link |
|---|---|---|---|---|---|---|
| 11-09-2001 | 17:47 | 3,7 | 55,2 km | 10.000 m | North Sea | usgs.gov |
| 09-09-2001 | 21:30 | 3,4 | 43,6 km | 10.000 m | The Netherlands | usgs.gov |
| 08-09-2001 | 23:58 | 3,8 | 28,1 km | 10.000 m | The Netherlands | usgs.gov |
| 04-12-1998 | 14:28 | 3,2 | 78,1 km | 10.000 m | North Sea | usgs.gov |
| 28-07-1995 | 12:24 | 4 | 26,6 km | 10.000 m | The Netherlands | usgs.gov |
| 20-09-1994 | 18:12 | 3,4 | 34,9 km | 5.000 m | The Netherlands | usgs.gov |
| 26-07-1993 | 23:07 | 3,5 | 76,9 km | 10.000 m | North Sea | usgs.gov |
| 01-12-1989 | 12:09 | 3,1 | 55,1 km | 10.000 m | The Netherlands | usgs.gov |
Callantsoog, Noord-Holland
Callantsoog is een dorp aan de Noordzee, in de gemeente Schagen in de provincie Noord-Holland. Het dorp is bekend als badplaats en vormde tot 1 januari 1990 een zelfstandige gemeente waarna het opging in de gemeente Zijpe. Sinds 1 januari 2013 is de gemeente Z.. Callantsoog Wikipedia Page
Over onze gegevens
De gegevens op deze pagina worden geschat met behulp van een aantal openbaar beschikbare hulpmiddelen en bronnen. Het wordt zonder garantie verstrekt en kan onnauwkeurigheden bevatten. Gebruik op eigen risico. Kijk hier voor meer informatie.