Ondernemingen in Apalachin
Hotels & Reizen
Restaurants
Automobiel
Financiële Diensten
Medisch
Beauty & Spas
Maatschappij & Overheid
Industries
Bedrijfsdistributie per bedrijfstak Winkelen: 16,2%
Medisch: 11,4%
Professionele Diensten: 10,3%
Automobiel: 9,6%
Industrie: 8,5%
Thuisdiensten: 8,3%
Restaurants: 7,6%
Lokale Diensten: 5,9%
Andere: 22,1%
| Industrie omschrijving | Aantal bedrijven | Gemiddelde leeftijd van het bedrijf | Gemiddelde Google-beoordeling | Bedrijven per 1.000 inwoners |
|---|---|---|---|---|
| Auto-onderdelen | 9 | 30,8 jaar | 4.5 | 8,1 |
| Autogarage | 12 | 27,6 jaar | 4.4 | 10,8 |
| Autowasserette en Detail | 5 | 4,5 | ||
| Benzinestations | 5 | 4.4 | 4,5 | |
| Nieuwe Autohandelaars | 7 | 19,8 jaar | 4.9 | 6,3 |
| Occasions garage | 6 | 28,7 jaar | 4.4 | 5,4 |
| Openbaar bestuur | 7 | 1.0 | 6,3 | |
| Algemene Aannemers | 11 | 31,8 jaar | 4.1 | 9,9 |
| Bouw anders | 6 | 36,5 jaar | 4.0 | 5,4 |
| Schoonmakers | 5 | 22,1 jaar | 4,5 | |
| Tuinarchitecten | 8 | 30,2 jaar | 5.0 | 7,2 |
| Bouw van gebouwen | 5 | 3.9 | 4,5 | |
| Groothandel bouwmaterialen | 5 | 4.0 | 4,5 | |
| Artsen en Chirurgen | 18 | 21,5 jaar | 3.8 | 16,2 |
| Fysiotherapie | 13 | 3.6 | 11,7 | |
| Medisch en gezondheid | 36 | 25,1 jaar | 3.7 | 32,4 |
| Psychiaters en psychologen | 6 | 5.0 | 5,4 | |
| Kerken | 11 | 59,9 jaar | 4.7 | 9,9 |
| Apotheken | 5 | 4.4 | 4,5 | |
| Bouwmarkten | 7 | 42,8 jaar | 3.3 | 6,3 |
| Gebied van Apalachin, New York (staat) | 1,467 mi² |
| Bevolking | 1.111 |
| Mannelijke bevolking | 572 (51,5%) |
| Vrouwelijke bevolking | 539 (48,5%) |
| Populatieverandering van 1975 tot 2015 | +7% |
| Populatieverandering van 2000 tot 2015 | -3,7% |
| Gemiddelde leeftijd | 42 |
| Gemiddelde leeftijd bij de mannen | 39,3 |
| Gemiddelde leeftijd bij de vrouwen | 44,8 |
| Netnummers | 607 |
| Buurten | Apalachin |
| Lokale tijd | zondag 00:36 |
| Tijdzone | Eastern-zomertijd |
| Breedte- & lengtegraad | 42.06952° / -76.15465° |
| Postcodes | 13732 |
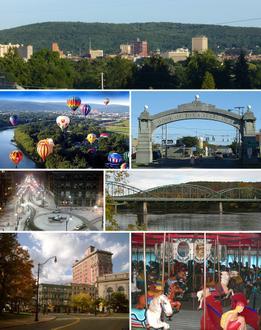
Apalachin, New York (staat) - Kaart
Apalachin, New York (staat) Bevolking
Jaren 1975 tot 2015| Gegevens | 1975 | 1990 | 2000 | 2015 |
|---|---|---|---|---|
| Bevolking | 1.038 | 1.025 | 1.154 | 1.111 |
| Bevolkingsdichtheid | 707,5 / mi² | 698,6 / mi² | 786,5 / mi² | 757,2 / mi² |
Apalachin Bevolkingswijziging van 2000 tot 2015
Afname van 3,7% van jaar 2000 tot 2015| Locatie | Wijziging sinds 1975 | Wijziging sinds 1990 | Wijziging sinds 2000 |
|---|---|---|---|
| Apalachin, New York (staat) | +7% | +8,4% | -3,7% |
| New York | +15,2% | +7,1% | +1,6% |
| Verenigde Staten | +46,9% | +27,2% | +13,7% |
Apalachin, New York (staat) Mediaan leeftijd
Gemiddelde leeftijd: 42 jaar| Locatie | Gemiddelde leeftijd | Mediane leeftijd (vrouw) | Mediane leeftijd (mannelijk) |
|---|---|---|---|
| Apalachin, New York (staat) | 42 jaar | 44,8 jaar | 39,3 jaar |
| New York | 38,1 jaar | 39,6 jaar | 36,6 jaar |
| Verenigde Staten | 37,4 jaar | 38,7 jaar | 36,1 jaar |
Apalachin, New York (staat) Bevolkingspiramide
Bevolking per leeftijd en geslacht| Leeftijd | Mannelijk | Vrouwelijk | Totaal |
|---|---|---|---|
| Onder 5 | 38 | 23 | 61 |
| 5-9 | 20 | 31 | 51 |
| 10-14 | 36 | 25 | 61 |
| 15-19 | 43 | 25 | 68 |
| 20-24 | 30 | 44 | 74 |
| 25-29 | 50 | 32 | 83 |
| 30-34 | 42 | 36 | 78 |
| 35-39 | 32 | 25 | 58 |
| 40-44 | 37 | 31 | 68 |
| 45-49 | 46 | 49 | 96 |
| 50-54 | 59 | 58 | 117 |
| 55-59 | 37 | 31 | 69 |
| 60-64 | 25 | 31 | 57 |
| 65-69 | 25 | 27 | 53 |
| 70-74 | 19 | 23 | 43 |
| 75-79 | 19 | 24 | 43 |
| 80-84 | 8 | 15 | 24 |
| 85 Plus | 6 | 9 | 15 |
Apalachin, New York (staat) Bevolkingsdichtheid
Bevolkingsdichtheid: 757,2 / mi²| Locatie | Bevolking | Gebied | Bevolkingsdichtheid |
|---|---|---|---|
| Apalachin, New York (staat) | 1.111 | 1,467 mi² | 757,2 / mi² |
| New York | 19,4 miljoen | 54.555,3 mi² | 355,2 / mi² |
| Verenigde Staten | 321,6 miljoen | 3.796.761,2 mi² | 84,7 / mi² |
Apalachin, New York (staat) Historische bevolking
Geschatte bevolking van 1740 tot 2015Sources:
1. JRC (European Commission's Joint Research Centre) work on the GHS built-up grid
2. CIESIN (Center for International Earth Science Information Network)
3. [Link] Klein Goldewijk, K., Beusen, A., Doelman, J., and Stehfest, E.: Anthropogenic land use estimates for the Holocene – HYDE 3.2, Earth Syst. Sci. Data, 9, 927–953, https://doi.org/10.5194/essd-9-927-2017, 2017.
Bedrijfsspreiding voor Apalachin, New York (staat)
Goedkoop: 50%
Matig: 37,5%
Duur: 9,4%
Erg Duur: 3,1%
Human Development Index (HDI)
Statistische samengestelde index van levensverwachting, opleiding en inkomen per hoofd van de bevolking.Sources: [Link] Kummu, M., Taka, M. & Guillaume, J. Gridded global datasets for Gross Domestic Product and Human Development Index over 1990–2015. Sci Data 5, 180004 (2018) doi:10.1038/sdata.2018.4
Apalachin, New York (staat) CO2-uitstoot
Kooldioxide (CO2) -emissies per hoofd van de bevolking in ton per jaar| Locatie | CO2 uitstoot | CO2-uitstoot per hoofd van de bevolking | CO2-emissie-intensiteit |
|---|---|---|---|
| Apalachin, New York (staat) | 17.852 ton | 16,1 ton | 12.167 ton/mi² |
| New York | 334.299.374 ton | 17,3 ton | 6.127 ton/mi² |
| Verenigde Staten | 5.664.619.809 ton | 17,6 ton | 1.491 ton/mi² |
Apalachin, New York (staat) CO2-uitstoot
| 2013 CO2-uitstoot (ton/jaar) | 17.852 ton |
| 2013 CO2-uitstoot (ton/jaar) per hoofd | 16,1 ton |
| 2013 CO2-uitstootintensiteit (ton/mi²/jaar) |
Natuurlijk gevarenrisico
Relatief risico op 10| Overstroming | Hoog (7) |
* Risico, met name met betrekking tot overstromingen of aardverschuivingen, is mogelijk niet voor het hele gebied.
Sources: 1. Dilley, M., R.S. Chen, U. Deichmann, A.L. Lerner-Lam, M. Arnold, J. Agwe, P. Buys, O. Kjekstad, B. Lyon, and G. Yetman. 2005. Natural Disaster Hotspots: A Global Risk Analysis. Washington, D.C.: World Bank. https://doi.org/10.1596/0-8213-5930-4.
2. Center for Hazards and Risk Research - CHRR - Columbia University, Center for International Earth Science Information Network - CIESIN - Columbia University. 2005. Global Flood Hazard Frequency and Distribution. Palisades, NY: NASA Socioeconomic Data and Applications Center (SEDAC). https://doi.org/10.7927/H4668B3D.
Over onze gegevens
De gegevens op deze pagina worden geschat met behulp van een aantal openbaar beschikbare hulpmiddelen en bronnen. Het wordt zonder garantie verstrekt en kan onnauwkeurigheden bevatten. Gebruik op eigen risico. Kijk hier voor meer informatie.