Ondernemingen in Broughton (Illinois)
Maatschappij & Overheid
Industries
Bedrijfsdistributie per bedrijfstak Industrie: 30,3%
Voedsel: 12,1%
Religie (Geloof): 12,1%
Maatschappij & Overheid: 12,1%
Winkelen: 9,1%
Thuisdiensten: 9,1%
Restaurants: 6,1%
Medisch: 3%
Automobiel: 3%
Financiële Diensten: 3%
| Gebied van Broughton (Illinois) | 1,996 mi² |
| Bevolking | 191 |
| Mannelijke bevolking | 94 (49,3%) |
| Vrouwelijke bevolking | 97 (50,7%) |
| Populatieverandering van 1975 tot 2015 | +25,7% |
| Populatieverandering van 2000 tot 2015 | -4% |
| Gemiddelde leeftijd | 44,8 |
| Gemiddelde leeftijd bij de mannen | 39,5 |
| Gemiddelde leeftijd bij de vrouwen | 49,9 |
| Netnummers | 618 |
| Lokale tijd | donderdag 04:57 |
| Tijdzone | Central-zomertijd |
| Breedte- & lengtegraad | 37.93477° / -88.46199° |
| Postcodes | 62817 |
Broughton (Illinois) - Kaart
Broughton (Illinois) Bevolking
Jaren 1975 tot 2015| Gegevens | 1975 | 1990 | 2000 | 2015 |
|---|---|---|---|---|
| Bevolking | 152 | 175 | 199 | 191 |
| Bevolkingsdichtheid | 76,1 / mi² | 87,7 / mi² | 99,7 / mi² | 95,7 / mi² |
Broughton (Illinois) Bevolkingswijziging van 2000 tot 2015
Afname van 4% van jaar 2000 tot 2015| Locatie | Wijziging sinds 1975 | Wijziging sinds 1990 | Wijziging sinds 2000 |
|---|---|---|---|
| Broughton (Illinois) | +25,7% | +9,1% | -4% |
| Illinois | +16,7% | +9,7% | +3,9% |
| Verenigde Staten | +46,9% | +27,2% | +13,7% |
Broughton (Illinois) Mediaan leeftijd
Gemiddelde leeftijd: 44,8 jaar| Locatie | Gemiddelde leeftijd | Mediane leeftijd (vrouw) | Mediane leeftijd (mannelijk) |
|---|---|---|---|
| Broughton (Illinois) | 44,8 jaar | 49,9 jaar | 39,5 jaar |
| Illinois | 36,6 jaar | 37,9 jaar | 35,3 jaar |
| Verenigde Staten | 37,4 jaar | 38,7 jaar | 36,1 jaar |
Broughton (Illinois) Bevolkingspiramide
Bevolking per leeftijd en geslacht| Leeftijd | Mannelijk | Vrouwelijk | Totaal |
|---|---|---|---|
| Onder 5 | 7 | 5 | 12 |
| 5-9 | 8 | 5 | 13 |
| 10-14 | 7 | 7 | 15 |
| 15-19 | 6 | 6 | 12 |
| 20-24 | 2 | 3 | 5 |
| 25-29 | 12 | 9 | 22 |
| 30-34 | 4 | 2 | 6 |
| 35-39 | 2 | 5 | 7 |
| 40-44 | 6 | 2 | 8 |
| 45-49 | 7 | 5 | 12 |
| 50-54 | 6 | 4 | 10 |
| 55-59 | 3 | 5 | 8 |
| 60-64 | 7 | 5 | 13 |
| 65-69 | 7 | 13 | 20 |
| 70-74 | 5 | 10 | 15 |
| 75-79 | 4 | 6 | 11 |
| 80-84 | 2 | 1 | 4 |
| 85 Plus | 1 | 5 | 7 |
Broughton (Illinois) Bevolkingsdichtheid
Bevolkingsdichtheid: 95,7 / mi²| Locatie | Bevolking | Gebied | Bevolkingsdichtheid |
|---|---|---|---|
| Broughton (Illinois) | 191 | 1,996 mi² | 95,7 / mi² |
| Illinois | 13,0 miljoen | 57.913,8 mi² | 224,0 / mi² |
| Verenigde Staten | 321,6 miljoen | 3.796.761,2 mi² | 84,7 / mi² |
Human Development Index (HDI)
Statistische samengestelde index van levensverwachting, opleiding en inkomen per hoofd van de bevolking.Sources: [Link] Kummu, M., Taka, M. & Guillaume, J. Gridded global datasets for Gross Domestic Product and Human Development Index over 1990–2015. Sci Data 5, 180004 (2018) doi:10.1038/sdata.2018.4
Broughton (Illinois) CO2-uitstoot
Kooldioxide (CO2) -emissies per hoofd van de bevolking in ton per jaar| Locatie | CO2 uitstoot | CO2-uitstoot per hoofd van de bevolking | CO2-emissie-intensiteit |
|---|---|---|---|
| Broughton (Illinois) | 3.746 ton | 19,6 ton | 1.876 ton/mi² |
| Illinois | 259.471.378 ton | 20 ton | 4.480 ton/mi² |
| Verenigde Staten | 5.664.619.809 ton | 17,6 ton | 1.491 ton/mi² |
Broughton (Illinois) CO2-uitstoot
| 2013 CO2-uitstoot (ton/jaar) | 3.746 ton |
| 2013 CO2-uitstoot (ton/jaar) per hoofd | 19,6 ton |
| 2013 CO2-uitstootintensiteit (ton/mi²/jaar) |
Natuurlijk gevarenrisico
Relatief risico op 10| Overstroming | Hoog (10) |
| Aardbeving | Gemiddels (6) |
* Risico, met name met betrekking tot overstromingen of aardverschuivingen, is mogelijk niet voor het hele gebied.
Sources: 1. Dilley, M., R.S. Chen, U. Deichmann, A.L. Lerner-Lam, M. Arnold, J. Agwe, P. Buys, O. Kjekstad, B. Lyon, and G. Yetman. 2005. Natural Disaster Hotspots: A Global Risk Analysis. Washington, D.C.: World Bank. https://doi.org/10.1596/0-8213-5930-4.
2. Center for Hazards and Risk Research - CHRR - Columbia University, Center for International Earth Science Information Network - CIESIN - Columbia University. 2005. Global Flood Hazard Frequency and Distribution. Palisades, NY: NASA Socioeconomic Data and Applications Center (SEDAC). https://doi.org/10.7927/H4668B3D.
3. Center for Hazards and Risk Research - CHRR - Columbia University, Center for International Earth Science Information Network - CIESIN - Columbia University. 2005. Global Earthquake Hazard Distribution - Peak Ground Acceleration. Palisades, NY: NASA Socioeconomic Data and Applications Center (SEDAC). https://doi.org/10.7927/H4BZ63ZS.
Recente aardbevingen in de buurt
Magnitude 3.0 en hoger| Datum | Tijd | Omvang | Afstand | Diepte | Locatie | Link |
|---|---|---|---|---|---|---|
| 19-09-2017 | 04:47 | 3,8 | 72,7 km | 11.680 m | 13km W of Mount Carmel, Illinois | usgs.gov |
| 08-09-2017 | 21:15 | 3,06 | 72,6 km | 11.760 m | 13km W of Mount Carmel, Illinois | usgs.gov |
| 30-04-2016 | 23:12 | 3,5 | 92,5 km | 16.260 m | 15km N of La Center, Kentucky | usgs.gov |
| 29-05-2015 | 17:41 | 3,4 | 59,3 km | 25.850 m | 9km N of Fairfield, Illinois | usgs.gov |
| 20-11-2012 | 15:28 | 3,6 | 75,8 km | 18.560 m | 13km WNW of Mount Carmel, Illinois | usgs.gov |
| 17-07-2008 | 19:58 | 3,1 | 75,1 km | 18.280 m | 12km WNW of Mount Carmel, Illinois | usgs.gov |
| 05-06-2008 | 00:13 | 3,4 | 79,1 km | 16.239 m | 8km WNW of Mount Carmel, Illinois | usgs.gov |
| 30-04-2008 | 22:30 | 3,3 | 78,1 km | 14.320 m | 9km WNW of Mount Carmel, Illinois | usgs.gov |
| 25-04-2008 | 10:31 | 3,7 | 77,1 km | 12.980 m | 10km WNW of Mount Carmel, Illinois | usgs.gov |
| 20-04-2008 | 22:38 | 4 | 76,7 km | 18.290 m | 10km WNW of Mount Carmel, Illinois | usgs.gov |
Zoek het optreden van aardbevingen nabij Broughton (Illinois)
Vroegste datum Uiterste datum
Magnitude 3.0 en hoger Magnitude 4.0 en hoger Magnitude 5.0 en hoger
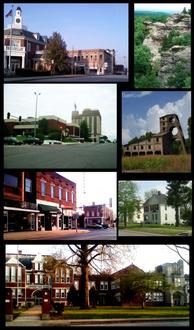
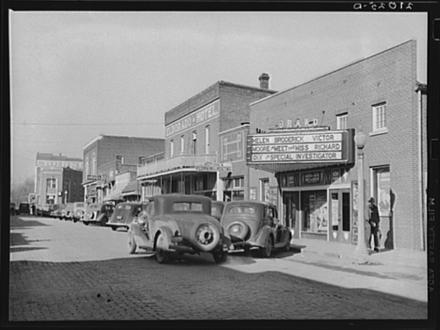
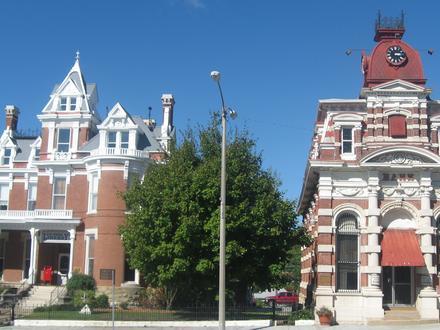
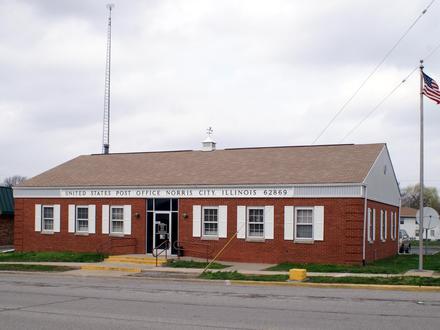
Broughton (Illinois)
Broughton is een plaats (village) in de Amerikaanse staat Illinois, en valt bestuurlijk gezien onder Hamilton County. Broughton (Illinois) Wikipedia Page
Over onze gegevens
De gegevens op deze pagina worden geschat met behulp van een aantal openbaar beschikbare hulpmiddelen en bronnen. Het wordt zonder garantie verstrekt en kan onnauwkeurigheden bevatten. Gebruik op eigen risico. Kijk hier voor meer informatie.