| Gebied van Fort Jesup, Louisiana (staat) | 4,3 mi² |
| Bevolking | 513 |
| Mannelijke bevolking | 262 (51,2%) |
| Vrouwelijke bevolking | 251 (48,8%) |
| Populatieverandering van 1975 tot 2015 | +5,3% |
| Populatieverandering van 2000 tot 2015 | +3,6% |
| Gemiddelde leeftijd | 36,6 |
| Gemiddelde leeftijd bij de mannen | 36,5 |
| Gemiddelde leeftijd bij de vrouwen | 36,7 |
| Lokale tijd | vrijdag 10:35 |
| Tijdzone | Central-zomertijd |
| Breedte- & lengtegraad | 31.61295° / -93.40295° |
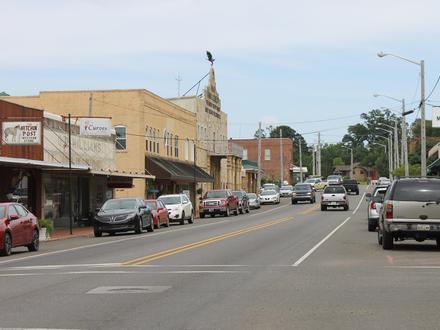
Fort Jesup, Louisiana (staat) - Kaart
Fort Jesup, Louisiana (staat) Bevolking
Jaren 1975 tot 2015Sources: JRC (European Commission's Joint Research Centre) work on the GHS built-up gridFort Jesup Bevolkingswijziging van 2000 tot 2015
Toename van 3,6% van jaar 2000 tot 2015 Sources: JRC (European Commission's Joint Research Centre) work on the GHS built-up gridFort Jesup, Louisiana (staat) Mediaan leeftijd
Gemiddelde leeftijd: 36,6 jaarSources: CIESIN (Center for International Earth Science Information Network)Fort Jesup, Louisiana (staat) Bevolkingspiramide
Bevolking per leeftijd en geslachtSources: CIESIN (Center for International Earth Science Information Network)Fort Jesup, Louisiana (staat) Bevolkingsdichtheid
Bevolkingsdichtheid: 119,3 / mi²Sources: JRC (European Commission's Joint Research Centre) work on the GHS built-up gridFort Jesup, Louisiana (staat) Historische en Geschatte Bevolking
Geschatte bevolking van 1710 tot 2100Sources:
1. JRC (European Commission's Joint Research Centre) work on the GHS built-up grid
2. CIESIN (Center for International Earth Science Information Network)
3. [Link] Klein Goldewijk, K., Beusen, A., Doelman, J., and Stehfest, E.: Anthropogenic land use estimates for the Holocene – HYDE 3.2, Earth Syst. Sci. Data, 9, 927–953, https://doi.org/10.5194/essd-9-927-2017, 2017.Human Development Index (HDI)
Statistische samengestelde index van levensverwachting, opleiding en inkomen per hoofd van de bevolking.Sources: [Link] Kummu, M., Taka, M. & Guillaume, J. Gridded global datasets for Gross Domestic Product and Human Development Index over 1990–2015. Sci Data 5, 180004 (2018) doi:10.1038/sdata.2018.4Fort Jesup, Louisiana (staat) CO2-uitstoot
Kooldioxide (CO2) -emissies per hoofd van de bevolking in ton per jaarSources: [Link] Moran, D., Kanemoto K; Jiborn, M., Wood, R., Többen, J., and Seto, K.C. (2018) Carbon footprints of 13,000 cities. Environmental Research Letters DOI: 10.1088/1748-9326/aac72aFort Jesup, Louisiana (staat) CO2-uitstoot
| 2013 CO2-uitstoot (ton/jaar) | 11.138 ton |
| 2013 CO2-uitstoot (ton/jaar) per hoofd | 21,7 ton |
| 2013 CO2-uitstootintensiteit (ton/mi²/jaar) | |
Natuurlijk gevarenrisico
Relatief risico op 10* Risico, met name met betrekking tot overstromingen of aardverschuivingen, is mogelijk niet voor het hele gebied.
Sources:
1. Dilley, M., R.S. Chen, U. Deichmann, A.L. Lerner-Lam, M. Arnold, J. Agwe, P. Buys, O. Kjekstad, B. Lyon, and G. Yetman. 2005. Natural Disaster Hotspots: A Global Risk Analysis. Washington, D.C.: World Bank. https://doi.org/10.1596/0-8213-5930-4.
2. Center for Hazards and Risk Research - CHRR - Columbia University, Center for International Earth Science Information Network - CIESIN - Columbia University. 2005. Global Flood Hazard Frequency and Distribution. Palisades, NY: NASA Socioeconomic Data and Applications Center (SEDAC). https://doi.org/10.7927/H4668B3D.
Recente aardbevingen in de buurt
Magnitude 3.0 en hoger︎ 2.859︎ op een afstand van 5,7 mi
︎ 18.259︎ op een afstand van 21,3 mi
︎ 1.862︎ op een afstand van 27,9 mi
︎ 964︎ op een afstand van 25,6 mi
Over onze gegevens
De gegevens op deze pagina worden geschat met behulp van een aantal openbaar beschikbare hulpmiddelen en bronnen. Het wordt zonder garantie verstrekt en kan onnauwkeurigheden bevatten. Gebruik op eigen risico. Kijk
hier voor meer informatie.