Ondernemingen in Grifton
Hotels & Reizen
Restaurants
Automobiel
Financiële Diensten
Medisch
Beauty & Spas
Maatschappij & Overheid
Industries
Bedrijfsdistributie per bedrijfstak Winkelen: 18,7%
Industrie: 13,1%
Thuisdiensten: 12,3%
Religie (Geloof): 9,9%
Automobiel: 8,1%
Professionele Diensten: 6,7%
Lokale Diensten: 5,8%
Andere: 25,4%
| Industrie omschrijving | Aantal bedrijven | Gemiddelde leeftijd van het bedrijf | Gemiddelde Google-beoordeling | Bedrijven per 1.000 inwoners |
|---|---|---|---|---|
| Kerken | 23 | 49,2 jaar | 4.7 | 8,6 |
| Gebied van Grifton, North Carolina | 1,699 mi² |
| Bevolking | 2.668 |
| Mannelijke bevolking | 1.236 (46,3%) |
| Vrouwelijke bevolking | 1.432 (53,7%) |
| Populatieverandering van 1975 tot 2015 | +105,1% |
| Populatieverandering van 2000 tot 2015 | +34,9% |
| Gemiddelde leeftijd | 38,9 |
| Gemiddelde leeftijd bij de mannen | 37,4 |
| Gemiddelde leeftijd bij de vrouwen | 40,2 |
| Netnummers | 252 |
| Lokale tijd | donderdag 23:06 |
| Tijdzone | Eastern-zomertijd |
| Breedte- & lengtegraad | 35.37266° / -77.43746° |
| Postcodes | 28530 |
Grifton, North Carolina - Kaart
Grifton, North Carolina Bevolking
Jaren 1975 tot 2015| Gegevens | 1975 | 1990 | 2000 | 2015 |
|---|---|---|---|---|
| Bevolking | 1.301 | 1.632 | 1.978 | 2.668 |
| Bevolkingsdichtheid | 765,8 / mi² | 960,6 / mi² | 1.164 / mi² | 1.570 / mi² |
Grifton Bevolkingswijziging van 2000 tot 2015
Toename van 34,9% van jaar 2000 tot 2015| Locatie | Wijziging sinds 1975 | Wijziging sinds 1990 | Wijziging sinds 2000 |
|---|---|---|---|
| Grifton, North Carolina | +105,1% | +63,5% | +34,9% |
| North Carolina | +99,6% | +54,2% | +27,7% |
| Verenigde Staten | +46,9% | +27,2% | +13,7% |
Grifton, North Carolina Mediaan leeftijd
Gemiddelde leeftijd: 38,9 jaar| Locatie | Gemiddelde leeftijd | Mediane leeftijd (vrouw) | Mediane leeftijd (mannelijk) |
|---|---|---|---|
| Grifton, North Carolina | 38,9 jaar | 40,2 jaar | 37,4 jaar |
| North Carolina | 37,5 jaar | 38,8 jaar | 36,1 jaar |
| Verenigde Staten | 37,4 jaar | 38,7 jaar | 36,1 jaar |
Grifton, North Carolina Bevolkingspiramide
Bevolking per leeftijd en geslacht| Leeftijd | Mannelijk | Vrouwelijk | Totaal |
|---|---|---|---|
| Onder 5 | 96 | 115 | 212 |
| 5-9 | 94 | 90 | 185 |
| 10-14 | 92 | 95 | 187 |
| 15-19 | 106 | 68 | 175 |
| 20-24 | 65 | 105 | 170 |
| 25-29 | 69 | 75 | 144 |
| 30-34 | 64 | 81 | 145 |
| 35-39 | 67 | 84 | 151 |
| 40-44 | 76 | 93 | 169 |
| 45-49 | 86 | 101 | 188 |
| 50-54 | 100 | 108 | 209 |
| 55-59 | 68 | 90 | 158 |
| 60-64 | 85 | 69 | 154 |
| 65-69 | 56 | 64 | 120 |
| 70-74 | 39 | 61 | 101 |
| 75-79 | 28 | 52 | 81 |
| 80-84 | 30 | 43 | 73 |
| 85 Plus | 15 | 37 | 53 |
Grifton, North Carolina Bevolkingsdichtheid
Bevolkingsdichtheid: 1.570 / mi²| Locatie | Bevolking | Gebied | Bevolkingsdichtheid |
|---|---|---|---|
| Grifton, North Carolina | 2.668 | 1,699 mi² | 1.570 / mi² |
| North Carolina | 10,3 miljoen | 53.819,4 mi² | 191,9 / mi² |
| Verenigde Staten | 321,6 miljoen | 3.796.761,2 mi² | 84,7 / mi² |
Grifton, North Carolina Historische en Geschatte Bevolking
Geschatte bevolking van 1760 tot 2100Sources:
1. JRC (European Commission's Joint Research Centre) work on the GHS built-up grid
2. CIESIN (Center for International Earth Science Information Network)
3. [Link] Klein Goldewijk, K., Beusen, A., Doelman, J., and Stehfest, E.: Anthropogenic land use estimates for the Holocene – HYDE 3.2, Earth Syst. Sci. Data, 9, 927–953, https://doi.org/10.5194/essd-9-927-2017, 2017.
Human Development Index (HDI)
Statistische samengestelde index van levensverwachting, opleiding en inkomen per hoofd van de bevolking.Sources: [Link] Kummu, M., Taka, M. & Guillaume, J. Gridded global datasets for Gross Domestic Product and Human Development Index over 1990–2015. Sci Data 5, 180004 (2018) doi:10.1038/sdata.2018.4
Grifton, North Carolina CO2-uitstoot
Kooldioxide (CO2) -emissies per hoofd van de bevolking in ton per jaar| Locatie | CO2 uitstoot | CO2-uitstoot per hoofd van de bevolking | CO2-emissie-intensiteit |
|---|---|---|---|
| Grifton, North Carolina | 47.981 ton | 18 ton | 28.243 ton/mi² |
| North Carolina | 168.507.440 ton | 16,3 ton | 3.130 ton/mi² |
| Verenigde Staten | 5.664.619.809 ton | 17,6 ton | 1.491 ton/mi² |
Grifton, North Carolina CO2-uitstoot
| 2013 CO2-uitstoot (ton/jaar) | 47.981 ton |
| 2013 CO2-uitstoot (ton/jaar) per hoofd | 18 ton |
| 2013 CO2-uitstootintensiteit (ton/mi²/jaar) |
Natuurlijk gevarenrisico
Relatief risico op 10| Cycloon | Hoog (9) |
| Overstroming | Hoog (7) |
* Risico, met name met betrekking tot overstromingen of aardverschuivingen, is mogelijk niet voor het hele gebied.
Sources: 1. Dilley, M., R.S. Chen, U. Deichmann, A.L. Lerner-Lam, M. Arnold, J. Agwe, P. Buys, O. Kjekstad, B. Lyon, and G. Yetman. 2005. Natural Disaster Hotspots: A Global Risk Analysis. Washington, D.C.: World Bank. https://doi.org/10.1596/0-8213-5930-4.
2. Center for Hazards and Risk Research - CHRR - Columbia University, Center for International Earth Science Information Network - CIESIN - Columbia University. 2005. Global Flood Hazard Frequency and Distribution. Palisades, NY: NASA Socioeconomic Data and Applications Center (SEDAC). https://doi.org/10.7927/H4668B3D.
3. Center for Hazards and Risk Research - CHRR - Columbia University, Center for International Earth Science Information Network - CIESIN - Columbia University, International Bank for Reconstruction and Development - The World Bank, and United Nations Environment Programme Global Resource Information Database Geneva - UNEP/GRID-Geneva. 2005. Global Cyclone Hazard Frequency and Distribution. Palisades, NY: NASA Socioeconomic Data and Applications Center (SEDAC). https://doi.org/10.7927/H4CZ353K.
Recente aardbevingen in de buurt
Magnitude 3.0 en hoger| Datum | Tijd | Omvang | Afstand | Diepte | Locatie | Link |
|---|---|---|---|---|---|---|
| 06-08-1994 | 12:54 | 3,8 | 71,1 km | 5.000 m | North Carolina | usgs.gov |
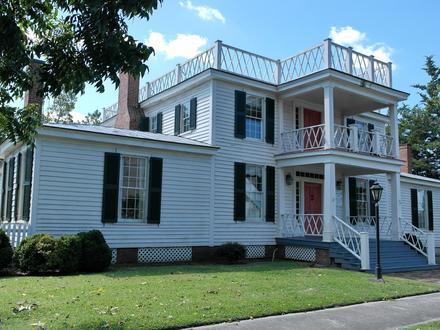
Grifton, North Carolina
Grifton is een plaats (town) in de Amerikaanse staat North Carolina, en valt bestuurlijk gezien onder Lenoir County en Pitt County. Grifton Wikipedia Page

Over onze gegevens
De gegevens op deze pagina worden geschat met behulp van een aantal openbaar beschikbare hulpmiddelen en bronnen. Het wordt zonder garantie verstrekt en kan onnauwkeurigheden bevatten. Gebruik op eigen risico. Kijk hier voor meer informatie.